

Value, Growth or Neither?
Published March 9, 2023

Pierre Debru
Head of Research, WisdomTree Europe.

Christopher Gannatti, CFA
Global Head of Research
Looking at equity markets as a conflict between value stocks and growth stocks has become a reflex for many market commentators. ‘Growth is beating value’ (or the other way around) is always a good headline.
As value stocks are defined basically as cheap stocks, it is possible to point to the value side of any index. Growth stocks are defined as stocks with above-average growth prospects, so again, it is possible to look at an index and point to the growthiest stocks. The main index providers have done exactly that by splitting their main indexes down the middle, into growth and value versions, since as early as the 1980s.
Using Value and Growth to Explain the Last 10 Years
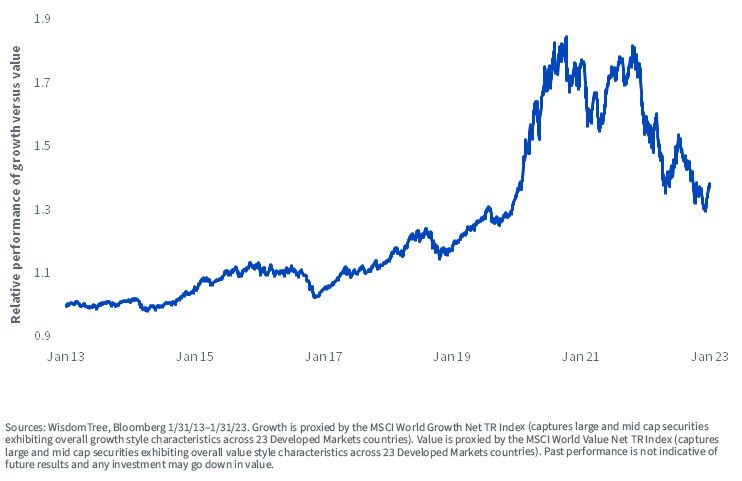
While simplistic, and playing into humans’ love of false dichotomies, this narrative explains the last 10 years of equity performance pretty well—from the overwhelming domination of growth stocks in a negative interest rate environment where investment was cheap, to the start of a value revival last year on the back of the most aggressive tightening cycle in decades.
Figure 1: Relative Performance of Growth vs. Value in the Last 10 Years
What About the Other Factors? Didn’t Quality Perform Better over that Period?
However, most things in our world can’t be reduced to a simple choice between black or white, good or evil, tea or coffee. Academics have demonstrated over the last five decades that multiple other factors can be used to slice and dice the markets to create outperforming portfolios. In the 1990s, Fama and French introduced their three-factors model, using value but also size and momentum to explain market returns. More recently, they added profitability (often called quality) and investment in a new five-factors model.
Looking at the performance of the seven leading factors over the last 10 years, we note that while growth beat the market by 1.6% per year and value underperformed by 1.9% per year, the strongest factor was, in fact, quality with an outperformance of 2.3% per year.
Is Quality Value or Growth, then?
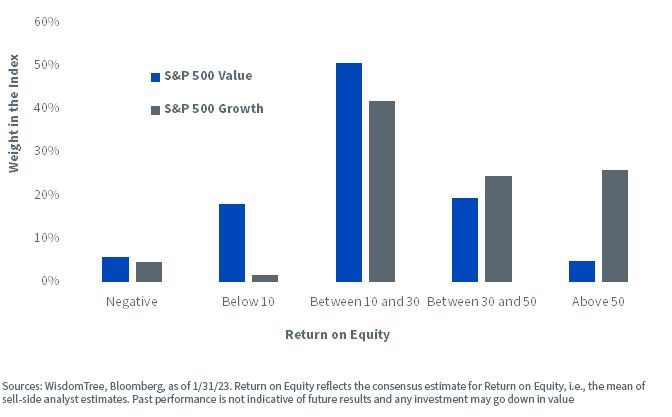
Using quality as a third lens, we observe that companies in the value index are, on average, less profitable than those in the benchmark and that those in the growth index are, on average, more so. Of companies in the S&P 500 Value, 23% exhibit less than 10 in return on equity (ROE) versus less than 5% for the S&P 500 Growth. And 25% of the S&P 500 Growth has more than 50 in ROE versus less than 5% for the value index.
Figure 2: S&P Value & S&P Growth Holdings Split by Return on Equity
However, what is fascinating is that in the value index, there are still some very profitable companies, and in the growth index there are still some unprofitable companies. In other words, the value/growth dichotomy is very different from the high quality/low quality one. The market could therefore be split, not into two indexes—value and growth—but into four:
- High-quality value
- High-quality growth
- Low-quality value
- Low-quality growth
Historically, High-Quality Value Outperformed High-Quality Growth
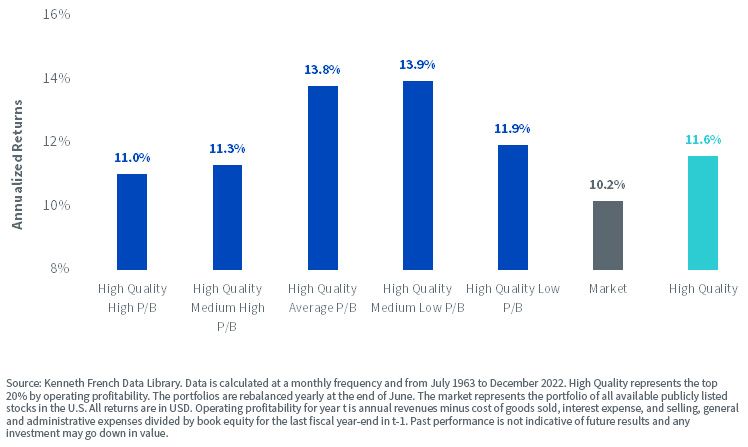
Using academic data, it is possible to splice U.S. equity markets since the 1960s into groups by fundamental data. In figure 3, we focus every year on the 20% of the universe with the highest operating profitability (i.e., High Quality in figure 3). That group is then split into five further quintiles depending on their valuations (using price-to-book as a metric) from the cheapest to the most expensive.
In figure 3, we can see that picking profitable companies with high prices to book would have outperformed the market since the 1960s, but would have underperformed profitable companies in general. In contrast, picking cheaper high-quality companies would have outperformed both the market and the overall high-quality grouping. In other words, quality value has outperformed quality growth over the last 60 years in U.S. equity markets. Looking at other geographies, such as Europe, we find similar results.
Figure 3: Annualized Returns of High-Quality Portfolios of U.S. Stocks Based on their Valuations since the 1960s
At WisdomTree, we believe that a well-constructed quality strategy can be the cornerstone of an equity portfolio (see here and here). High-quality companies exhibit an ‘all-weather’ behavior that promises a balance between building wealth over the long term while protecting the portfolio during economic downturns. However, in 2022, secondary tilts were incredibly important. Value stocks benefitted from central banks’ hawkishness, leaning on their low implied duration to deliver outstanding performance in a particularly hard year for equities. Among quality-focused strategies, the one with a value tilt delivered outperformance on average, and the one with a growth tilt tended to underperform.
Looking forward to 2023, recession risk continues to hang over the market like the sword of Damocles. While inflation has shown signs of easing, we expect central banks to remain hawkish around the globe as inflation is still very meaningfully above targets. The recent coordinated communication plan by Federal Reserve Federal Open Market Committee members is a further example of this continued hawkishness. With markets facing many of the same issues in 2023 that they faced in the second half of 2022, it looks like resilient investments that tilt to quality and value that have done particularly well in 2022 could continue to benefit.
Quality Dividend Growth—A Recognized Quality Strategy with a Successful Track Record
At WisdomTree, our “Quality Dividend Growth” strategies aim to leverage this quality and value partnership in the most efficient way. Our strategy, with $11.6 billion2 under management globally, focuses on high-quality companies that can grow their dividends.
Our ETF portfolio is constructed around dividend paying companies with the best-combined rank of earnings growth, ROE and return on assets within a universe of companies with sustainable dividend policies. Stocks are also risk-tested using a proprietary risk screen (Composite Risk Score), which uses quality and momentum metrics to rank companies and screen out the riskiest companies and potential value traps. Each company is then weighted based on its cash dividend paid (market capitalization x dividend yield), which introduces valuation discipline in this high-quality portfolio. Those steps in combination deliver a thoughtfully blended exposure to quality and value.
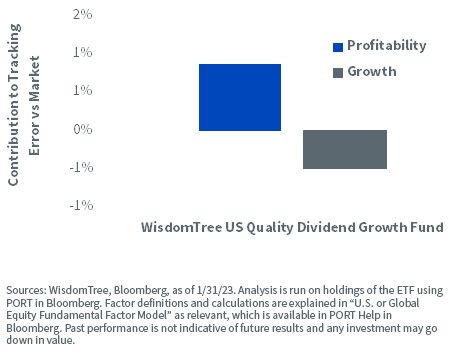
Figure 4 illustrates how the WisdomTree U.S. Quality Dividend Growth Fund (DGRW) delivers high exposure to profitability but also negative exposure to growth.
Figure 4: Factor Exposure of WisdomTree U.S. Quality Dividend Growth Fund
1 Sources: WisdomTree, Bloomberg. 1/31/13–1/31/23. Growth is proxied by the MSCI World Growth Net TR Index. Value is proxied by the MSCI World Value Net TR Index. Quality is proxied by MSCI World Quality Net TR Index. The remaining four factors (Min Vol, High Dividend, Small Cap and Momentum) are also proxied by indexes in the MSCI families. Past performance is not indicative of future results and any investment may go down in value.
2 As of 2/8/23.
Important Risks and Disclosure Related to this Article
There are risks associated with investing, including the possible loss of principal. Funds focusing their investments on certain sectors increase their vulnerability to any single economic or regulatory development. This may result in greater share price volatility. Dividends are not guaranteed, and a company currently paying dividends may cease paying dividends at any time. Please read the Fund’s prospectus for specific details regarding the Fund’s risk profile.
Pierre Debru is an employee of WisdomTree UK Limited, a European subsidiary of WisdomTree Asset Management Inc.’s parent company, WisdomTree Investments, Inc.
Related articles

When AI Leaves the Screen and Enters the Physical World

Dividend Growth Is Not One Strategy

Behind the Charts: Is the Energy Trade Running Out of Fuel?
Quality as a Foundation in an Uncertain World

The Company at the Center of the AI Economy

A Dog, a Diagnosis and a Different Way to Understand AI
The Market's Pendulum May Be Swinging Back to Value
Rising Through Discipline: Why DGRW and DDWM Are Earning Their Upgrades

The 2026 Market: A World of Constant Rotation
About the contributors

Pierre Debru
Head of Research, WisdomTree Europe.
Pierre Debru leads WisdomTree’s European research team and plays a pivotal role in the strategic direction of our European research efforts. His key areas of expertise extend across equity factors and quantitative strategies, portfolio construction and model portfolios, and thematic and crypto investments. Before joining the company in 2019, Pierre worked in Investment Research for DWS and the Xtrackers range for over five years. During this period, he focused on smart beta investments, model portfolio construction and thought leadership. Pierre has over 20 years of experience in investments and structured asset management. He graduated from Ecole Central Paris and obtained a Master of Science in Mathematics applied to Finance.

Christopher Gannatti, CFA
Global Head of Research
Christopher Gannatti began at WisdomTree as a Research Analyst in December 2010, working directly with Jeremy Schwartz, CFA®, Director of Research. In January of 2014, he was promoted to Associate Director of Research where he was responsible to lead different groups of analysts and strategists within the broader Research team at WisdomTree. In February of 2018, Christopher was promoted to Head of Research, Europe, where he was based out of WisdomTree’s London office and was responsible for the full WisdomTree research effort within the European market, as well as supporting the UCITs platform globally. In November 2021, Christopher was promoted to Global Head of Research, now responsible for numerous communications on investment strategy globally, particularly in the thematic equity space. Christopher came to WisdomTree from Lord Abbett, where he worked for four and a half years as a Regional Consultant. He received his MBA in Quantitative Finance, Accounting, and Economics from NYU’s Stern School of Business in 2010, and he received his bachelor’s degree from Colgate University in Economics in 2006. Christopher is a holder of the Chartered Financial Analyst Designation.