
To Be Value or to Be Growth?—That Is the Question.


WisdomTree began launching ETFs and Indexes in 2006. For much of this period, the growth style of investing, epitomized initially by “tech stocks” and more recently by such acronyms as “FAANG” (Facebook, Amazon, Apple, Netflix, Google), drove market benchmarks seemingly ever higher.
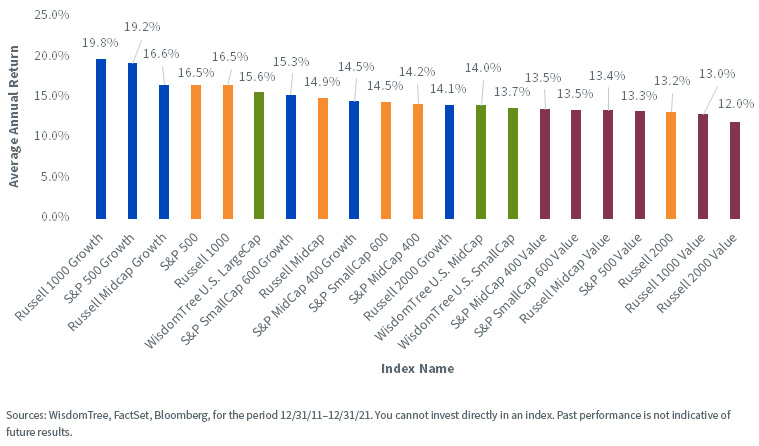
Over the period of 10 years ending December 31, 2021, we show in figure 1:
- Blue bars represent the “growth” style of investing. The Russell 1000 Growth and S&P 500 Growth Indexes outperformed the other mid- and small-cap growth indexes. In other words, “large-cap growth” outperformed mid-cap and small-cap growth over this period.
- Orange bars represent the “core” benchmarks—those that include both value-oriented and growth-oriented companies. Large caps outperformed mid-caps and small caps in this grouping as well.
- Green bars represent WisdomTree’s earnings-weighted Indexes. The WisdomTree U.S. LargeCap Index outperformed the WisdomTree U.S. MidCap and SmallCap Indexes.
- Red bars represent value-oriented strategies. These strategies lagged over this period, but we’d note that the Russell 2000 Value Index—the worst-performing Index in figure 1—still had an average annual return of 12.0%. This is still quite a strong average annual return for a 10-year period.
Figure 1: Average Annual Returns of Specified Indexes over 10 Years
For definitions of terms/indexes in the chart above please visit the glossary.
2022: The Growth Style Swaps Performance Leadership with the Value Style
When longstanding trends simply continue, it tends to lull investors into a sense that markets are not dynamic and do not tend toward change. However, we hear all the time that “past performance is not indicative of future results,” so shifts in trends are good to remind us that almost nothing in markets should be viewed as a constant.
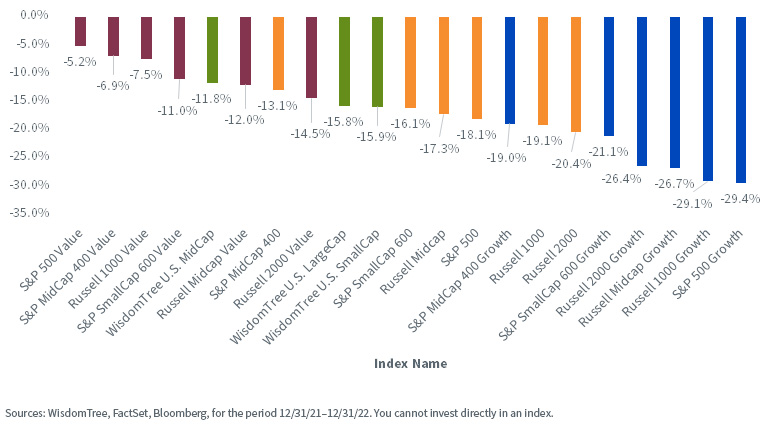
2022 was a year where, suddenly, the value style of investing dramatically outperformed the growth style. We see in figure 2:
- Remember those blue bars—the growth-oriented indexes? They are now all the way to the right-hand side, indicating the worst performance in the group over the period. Additionally, the Russell 1000 Growth and S&P 500 Growth Indexes—those focused on large caps—were the two worst-performing indexes in figure 2.
- Remember those red bars—the value-oriented indexes? They are now all the way to the left side of the figure, indicating the best performance in figure 2 over the period.
- The green bars, representing the WisdomTree earnings strategies, remained in the middle of the figure, as did the orange bars representing the core strategies.
- Importantly, every bar in figure 2 represented a negative return, telling us it was a particularly tough year.
Figure 2: Cumulative Return of Specified Indexes over 2022 Full-Year Period
Are Earnings Strategies “Value” or “Growth” Oriented?
It’s clear that “earnings” represents something different than the value or growth styles, as there is a difference between a single fundamental—like earnings—and a style of investment or a benchmark, such as growth or value, that can be defined in multiple different ways.
Based on figures 1 and 2, earnings is located somewhere between the growth and value styles and tilted a little bit more toward value than growth.
Sector exposure is another detail useful to help in characterizing different index exposures. Some sectors are associated with value, whereas others have more of an orientation to growth.
Throwing a Wrench into Index Sector Exposure Analysis: The S&P 2022 Rebalance
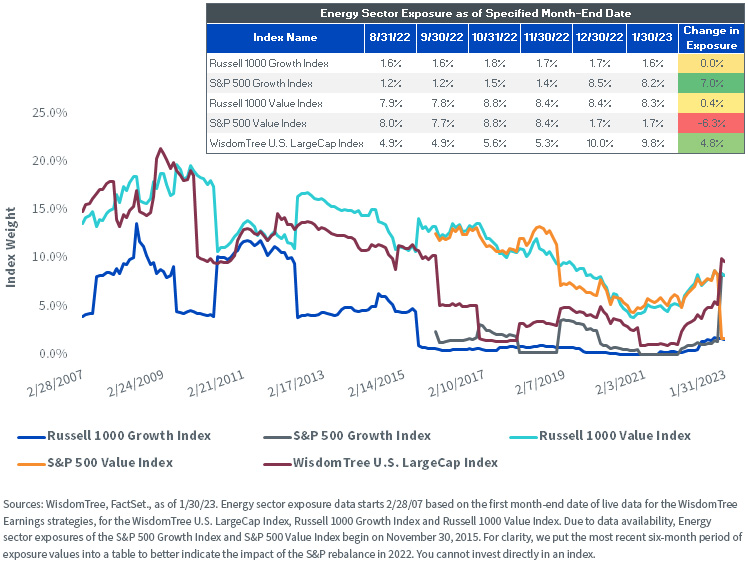
My colleague Jeremy Schwartz wrote about a surprising rebalance season for the S&P in December 2022. The S&P’s growth criteria includes a sensitivity to 12-month price momentum and led to rather interesting circumstances for the Energy and Technology sectors.
- Energy performed very, very well in 2022—much better than other sectors, especially in U.S. large caps.
- The S&P 500 Growth Index Energy weight as of August 31, 2022, was only 1.2%. Exposure to Energy at the end of January 2023 was 8.2%, a full 7% higher due to the rebalance. The Energy sector still had the lowest price-to-earnings (P/E) ratio out of all S&P 500 Index sectors as of this time—usually something one would associate more with value than with growth.
- The S&P 500 Value Index had an 8.0% exposure to Energy in August 2022. As of the end of January 2023, this figure had changed to 1.7%–6.3% lower due to the S&P’s rebalance. The Index oriented toward the value-style of investing took the lowest P/E sector and REDUCED exposure, a direct counter to our intuition.
- The WisdomTree U.S. LargeCap Index also has a rebalancing process that occurs in December of each year. In December 2022, this strategy added exposure to the Energy sector. Notably, this strategy simply follows the earnings streams of its constituents. When a sector has an increase in weight, it generally indicates that the growth of profits occurred to a greater magnitude than the growth of the market capitalization or share price over the prior year’s period.
In addition to giving more weight to companies growing earnings, a consequence of following the earnings streams is a lower P/E ratio than a comparable index of companies that is market capitalization-weighted.
Figure 3: Energy Sector Exposure across Large-Cap Indexes
Bottom Line: Is It More Important to Cut Off Momentum or Follow the Earnings?
We can first recognize that none of us knows how things will perform going forward. However, we can understand the rationale as to why certain things happened:
- The S&P 500 Growth Index added Energy sector exposure due to strong price momentum over the prior 12 months, as well as good growth in earnings.
- The S&P 500 Value Index serves very much as the other side of the seesaw to the S&P 500 Growth Index, meaning that if exposure to Energy is going up in the Growth Index, it likely will not go up in the Value Index. Energy ended up being more “growth” than “value,” leading to the S&P 500 Value Index cutting the sector with the best momentum but also the lowest P/E ratio.
- The WisdomTree U.S. LargeCap Index added weight to Energy—but this was based on profit growth outperforming share price growth.
At WisdomTree, we believe in following fundamentals. The market rewarded growth irrespective of valuations in recent history. Our earnings-weighted approach aims to help consistently manage valuation risk as we look ahead.
Share & Comment
Popular Posts
Categories
Related Links
Christopher Gannatti began at WisdomTree as a Research Analyst in December 2010, working directly with Jeremy Schwartz, CFA®, Director of Research. In January of 2014, he was promoted to Associate Director of Research where he was responsible to lead different groups of analysts and strategists within the broader Research team at WisdomTree. In February of 2018, Christopher was promoted to Head of Research, Europe, where he was based out of WisdomTree’s London office and was responsible for the full WisdomTree research effort within the European market, as well as supporting the UCITs platform globally. In November 2021, Christopher was promoted to Global Head of Research, now responsible for numerous communications on investment strategy globally, particularly in the thematic equity space. Christopher came to WisdomTree from Lord Abbett, where he worked for four and a half years as a Regional Consultant. He received his MBA in Quantitative Finance, Accounting, and Economics from NYU’s Stern School of Business in 2010, and he received his bachelor’s degree from Colgate University in Economics in 2006. Christopher is a holder of the Chartered Financial Analyst Designation.