

DGRW Turns 10!
Published June 14, 2023

Alejandro Saltiel, CFA
Head of Indexes, U.S.

Hyun Kang
Research Analyst
The WisdomTree U.S. Quality Dividend Growth Fund (DGRW) had its 10-year anniversary on May 22, following that of the Index it tracks, the WisdomTree U.S. Quality Dividend Growth Index (WTDGI), in April.
The investment objective behind the Fund has remained consistent, providing investors with exposure to companies that look attractive across measures of profitability—return on equity (ROE) and return on assets (ROA)—and earnings growth expectations, and weighting companies by cash dividends to keep valuations in check.
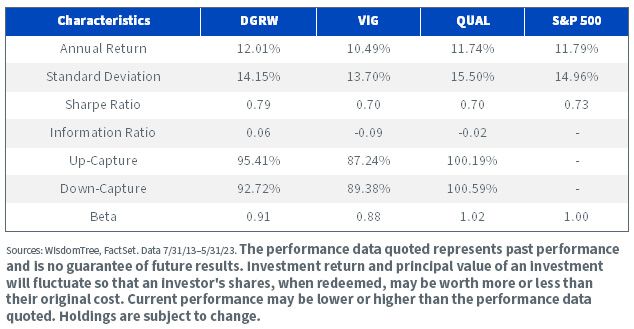
DGRW’s way of assessing a company’s quality (profitability) and ability to grow dividends allowed it to outperform the broad S&P 500 Index by 0.22% annually over the past 10 years. Standardized performance for the fund can be found here. DGRW outperformed the largest quality factor ETF, the iShares MSCI USA Quality Factor ETF (QUAL), by 0.27% since the latter’s inception in July 2013. Standardized performance information for QUAL can be found on the fund site. DGRW also outperformed the largest dividend growth ETF, the Vanguard Dividend Appreciation ETF (VIG) by 1.52%. Standardized performance information for VIG can be found on the fund site. DGRW has shown lower volatility than the S&P 500 and QUAL over the period and has higher risk-adjusted returns than the previously mentioned comparables.1
Growth of $100
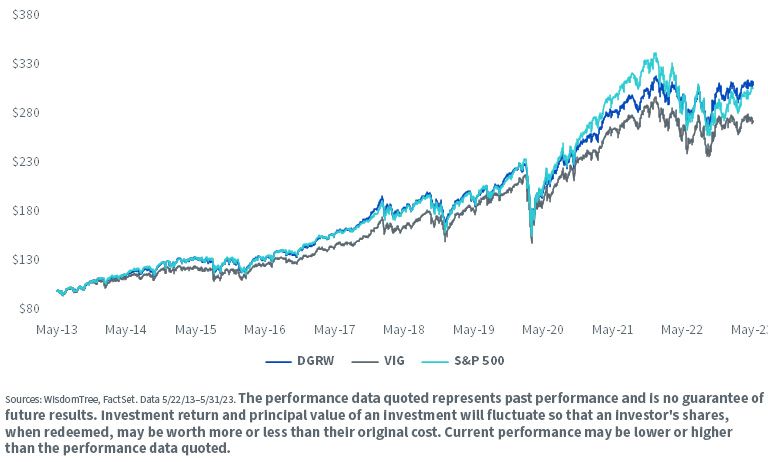
For the most recent month-end performance, click here.
To learn more about the differences between the funds being compared, please see the Additional Information section below.
Genesis of the Strategy (Ethos of the Strategy Remains Unchanged)
When WTDGI launched in 2013 after extensive research, our now Global CIO Jeremy Schwartz and Global Head of Research Christopher Gannatti published two white papers: “The Dividends of a Quality and Growth Factor Approach” and “Waiting for Dividends vs. Weighting by Dividends.” Jeremy and Chris expanded on the rationale for using ROE and ROA as the measures of quality, along with using a forward-looking dividend growth screen instead of a backward-looking one. They also highlighted how a broad quality methodology would be better positioned to compete against the broader market over time. To learn more about this methodology, read this blog post celebrating WTDGI’s 10-year anniversary.
Quality Factor Rankings: “…we have identified higher-quality companies as those that have displayed above-average historical returns on equity and on assets. We have used these criteria as part of our selection methodology, because we believe companies with better profitability metrics are better able to fund growing dividends.… There are also the investment practitioners who focus on ROE. Warren Buffett often says, as he did in his most recent (2014) annual letter, that he looks for “businesses earning good returns on equity while employing little or no debt.” Since high leverage involves the use of debt, our use of a quality ranking that incorporates both return on equity and return on assets enables us to mitigate the use of leverage as a sole driver of what may superficially appear to be a high ROE figure.
In the finance literature, return on equity is critically linked to dividend growth and intrinsic value of companies through the dividend discount model (DDM). The DDM for (current) stock valuation states:
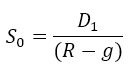
where D_1 represents dividends per share expected to be received in one year, R represents the required rate of return for the investment and g stands for the growth rate in dividends which can be decomposed into ROE x earnings retention.”2
Forward-Looking Dividend Growth Screen: “One of the most critical differences between the WisdomTree U.S. Dividend Growth Index and the NASDAQ US Dividend Achievers Select Index is that the latter requires 10 consecutive years of dividend growth in order to qualify for inclusion, while the former does not. Why does this matter? Because we believe that dividend indexes with backward-looking growth screens may fail to capture growth opportunities—and we believe that performance will bear this out.
…a simple example of the difference is the case of Apple. As one of the largest dividend payers in the United States, Apple is included in the WisdomTree U.S. Dividend Growth Index—but it won’t be eligible for inclusion in the NASDAQ US Dividend Achievers Select Index until 2023. Additionally, it is worth noting that not only does WisdomTree require a dividend, it also uses numerous quality screens and weights by dividends.”3
Broad Exposure: “One of the keys, in our opinion, is to not dilute the potential power of what others have mentioned above (characteristics of different quality factor portfolios) by trying to apply too many stock selection rules or complex weighting schemes. The key is to be as simple and broad-based as possible, while still tilting toward companies with low debt and high return on equity, which we believe to be an important common thread across the many varied interpretations of what quality means to different practitioners.”4
Quality Dividend Growth Exposure = Better Risk-Adjusted Returns
The methodology of DGRW’s Index, WTDGI, has tended to result in a basket of securities that has a higher dividend yield, lower trailing and forward price-to-earnings multiples, and higher quality metrics than the S&P 500. DGRW also has a higher dividend yield than the dividend appreciation strategy of VIG.
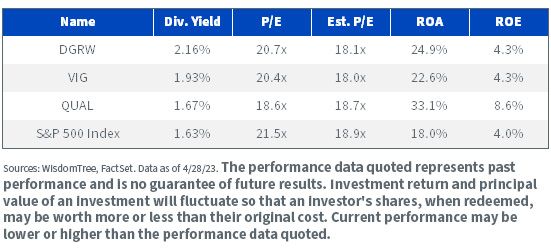
For the most recent month-end and standardized performance, current yield, and to download the fund prospectus, click the respective ticker: DGRW, VIG, QUAL.
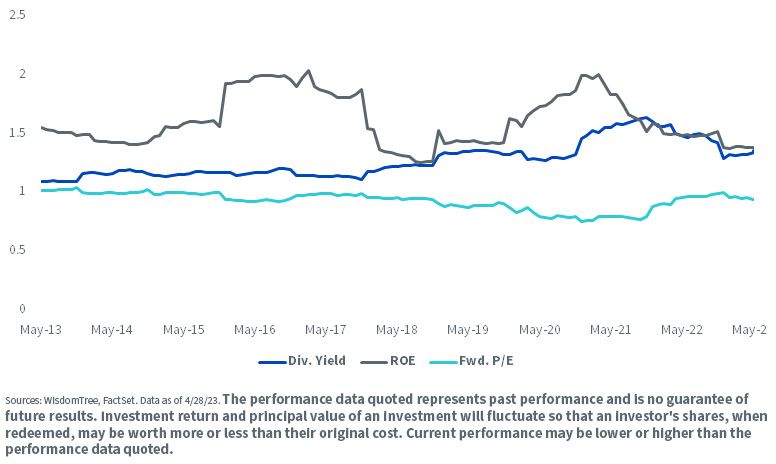
Historically, these characteristics of DGRW relative to the broad market have been consistent. As shown in the chart below, the factor of DGRW’s ROE has consistently been north of 1.5x that of the S&P 500. DGRW’s dividend yield has also consistently been higher than the S&P 500, remaining above 1x since the Fund’s inception 10 years ago. What is fascinating is that DGRW has accomplished this while trading at a discount to the S&P 500, as can be seen in the relative forward price-to-earnings being less than 1x.
Historical Relative Fundamentals (DGRW vs. S&P 500)
For the most recent month-end performance, click here.
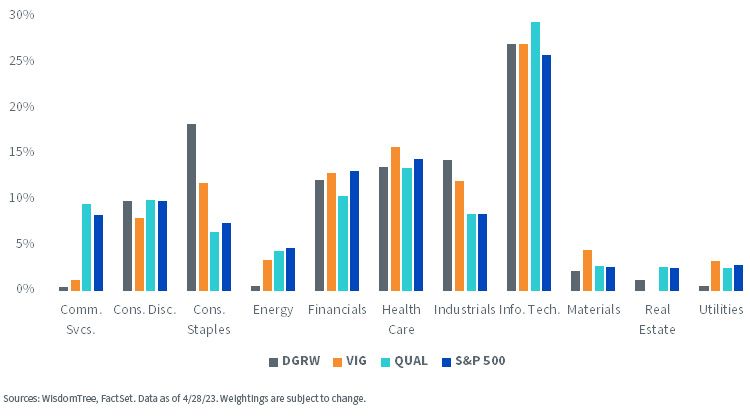
DGRW’s sector exposures depend on the stage of the economic cycle, as its selection relies on profitability and growth characteristics. As we can see on the chart below, DGRW currently has an over-weight allocation to Consumer Staples and Industrials and under-weight allocation to Communication Services and Energy relative to the broad market. One of the main points of criticism for a single factor strategy like QUAL has to do with its sector neutrality relative to the broad market. We find it difficult to justify a fixed exposure to a certain sector regardless of its aggregate profitability metrics.
Conclusion
As mentioned earlier, DGRW’s investment process has allowed it to outperform the S&P 500 and its competitors both on an absolute and risk-adjusted basis. As we can see below, risk characteristics for DGRW are very attractive for a core exposure in an investor’s portfolio.
1 Sources: WisdomTree, FactSet. Data 5/22/13–5/31/23.
2 Source: WisdomTree, “The Dividends of a Quality and Growth Factor Approach”
3 Source: WisdomTree, “Waiting for Dividends vs. Weighting by Dividends”
4 Source: WisdomTree, “The Dividends of a Quality and Growth Factor Approach”
Additional Information and Important Risks Related to this Article
The WisdomTree Quality Dividend Growth Fund (DGRW) seeks to track the investment results of dividend-paying large-cap companies with growth characteristics in the U.S. equity market. It has a gross expense ratio of 0.28% and tracks the price and yield performance, before fees and expenses, of the WisdomTree U.S. Quality Dividend Growth Index. The Vanguard Dividend Appreciation ETF (VIG) invests in large-cap equities, emphasizing stocks with a record of growing their dividends year over year. It has an expense ratio of 0.06% and seeks to track the performance of the S&P U.S. Dividend Growers Index. The iShares MSCI USA Quality Factor ETF provides exposure to large- and mid-cap U.S. stocks exhibiting positive fundamentals and quality characteristics (high return on equity, stable year-over-year earnings growth and low financial leverage). It seeks to track the price and performance of the MSCI USA Sector Neutral Quality Index and has an expense ratio of 0.15%. QUAL and VIG were chosen for comparison as they are the largest quality factor and dividend appreciation ETFs, respectively, aligning with DGRW's primary investment objective of quality focus and dividend growth.
All funds are managed differently and do not react the same to economic or market events. The investment objectives, strategies, policies or restrictions of other funds may differ and more information can be found in their respective prospectuses. Therefore, we generally do not believe it is possible to make direct fund to fund comparisons in an effort to highlight the benefits of a fund versus another similarly managed fund.
There are risks associated with investing, including the possible loss of principal. Funds focusing their investments on certain sectors increase their vulnerability to any single economic or regulatory development. This may result in greater share price volatility. Dividends are not guaranteed, and a company currently paying dividends may cease paying dividends at any time. Please read the Fund’s prospectus for specific details regarding the Fund’s risk profile.
The purpose of this material is to provide financial professionals with a means to evaluate the investment methodology of the Funds and Indexes, as compared to various other funds/indexes. It is the opinion of WisdomTree that all funds and indexes are managed differently and do not react the same to economic or market events. The investment objectives, strategies, policies or restrictions of other funds may differ, and more information can be found in their respective prospectuses. Therefore, we generally do not believe it is possible to make direct fund-to-fund comparisons in an effort to highlight the benefits of a fund versus another similarly managed fund. The information included in this material is based upon data obtained from FactSet and WisdomTree’s database, which is are believed to be accurate. This material is not considered an offer to sell or a solicitation to buy shares of any other funds mentioned herein.
Related articles

Rules Over Headlines: WisdomTree’s Approach to Growth Investing

Built for Any Market: How Blending Growth and Value Creates a Stronger Core

Dividend Growth Is Not One Strategy
Quality as a Foundation in an Uncertain World

The Company at the Center of the AI Economy

A Dog, a Diagnosis and a Different Way to Understand AI
Rising Through Discipline: Why DGRW and DDWM Are Earning Their Upgrades

Are Two Complementary Strategies Continuing to Create a Better Core in 2026?
The Long Game of Dividend Growth Investing
About the contributors

Alejandro Saltiel, CFA
Head of Indexes, U.S.
Alejandro Saltiel joined WisdomTree in May 2017 as part of the Quantitative Research team. Alejandro oversees the firm’s Equity indexes and actively managed ETFs. He is also involved in the design and analysis of new and existing strategies. Alejandro leads the quantitative analysis efforts across equities and alternatives and contributes to the firm’s website tools and model portfolio infrastructure. Prior to joining WisdomTree, Alejandro worked at HSBC Asset Management’s Mexico City office as Portfolio Manager for multi-asset mutual funds. Alejandro received his Master’s in Financial Engineering degree from Columbia University in 2017 and a Bachelor’s in Engineering degree from the Instituto Tecnológico Autónomo de México (ITAM) in 2010. He is a holder of the Chartered Financial Analyst designation.

Hyun Kang
Research Analyst
Hyun Kang joined WisdomTree in July 2022 as a Research Analyst. As a part of the Index team, he assists with the creation and maintenance of the firm’s indexes and supports the group’s research initiatives across various strategies. Hyun graduated from Carnegie Mellon University, with a B.S. in Business Administration and an additional major in Statistics and Machine Learning.