
The Dividend Driver: Return on Equity


A key driver of long-term compound returns is dividend growth. But what drives the driver? Corporate profitability.
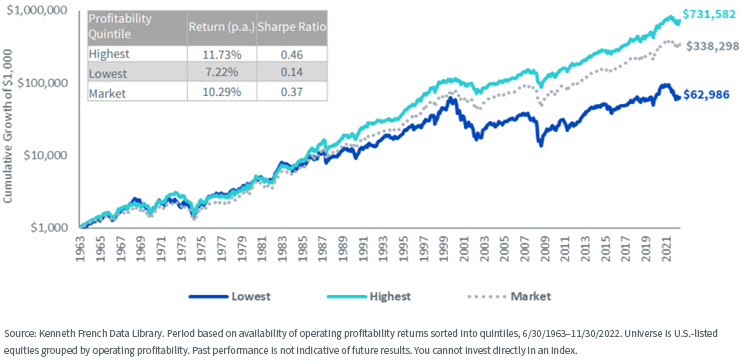
Using over a half-century of data from Ken French’s computations at Dartmouth, a strategy that identified the top 20% of stocks by profitability (return on equity, or ROE) posted annual returns of 11.73%, an outperformance of 451 basis points (bps) per year over the lowest ROE group. The high-ranking group also bested the market by 144 bps per year.
Part of the explanation: profitable companies grew dividends faster.
Figure 1: Equity Performance, Grouped by Profitability
Triggering Robust Future Dividends: The Profile of a Profitable Grower
The DuPont Corporation’s Donaldson Brown developed a concept a century ago that breaks ROE into an interaction between profit margins, asset turnover and the equity multiplier.
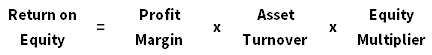
Those can be expressed as follows:
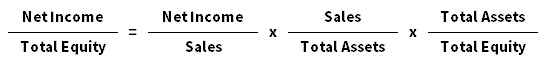
Notice that some denominators are also numerators. As they cancel each other, we are left with income over equity, or ROE. If a firm wants to be profitable, it must have excellent margins and be efficient with its assets.
Suppose a company earns $1 per share and pays a 25-cent dividend, leaving 75 cents in retained earnings. The retention ratio is 75%.
Multiply the retention ratio by the ROE to get implied dividend growth.
Visually:
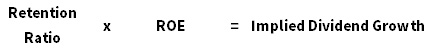
If the company’s ROE is 10%, the implied annual dividend growth rate is 0.75 x 10%, or 7.5%.
Figure 2 shows these concepts using current metrics for the WisdomTree U.S. Quality Dividend Growth Fund (DGRW) and the WisdomTree U.S. SmallCap Quality Dividend Growth Fund (DGRS).
Figure 2: DuPont Inside DGRW & DGRS
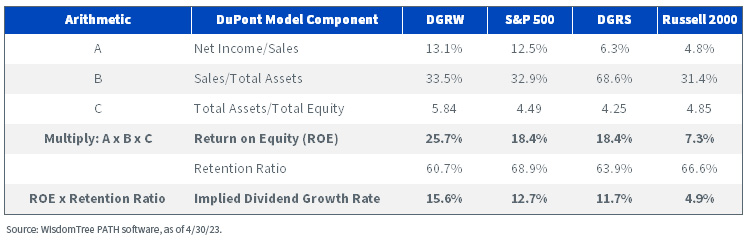
Both DGRW and DGRS score well on profit margins (A) and asset turnover (B). The equity multiplier (C) for DGRW indicates that component companies have a little more leverage than S&P 500 members, while DGRS has less leverage than the Russell 2000.
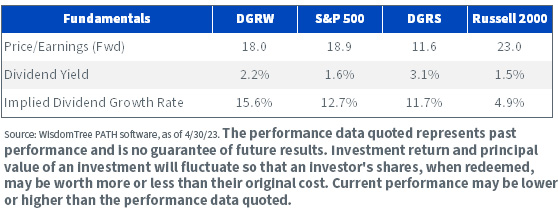
DGRW’s current dividend yield is 2.2%, which at face value is something of a yawn when compared to the 1.6% yield accorded the S&P 500. However, the former’s more robust ROE opens the door for a faster dividend growth rate in the future (figure 3). The same goes for DGRS in small caps.
Figure 3: Quality Dividend Growth Fundamentals
For the most recent month-end performance, please click the respective ticker: DGRW, DGRS.
For definitions of terms in the table above, please visit the glossary.
Next, developed and emerging markets. Figure 4 runs the numbers for:
- The WisdomTree International Quality Dividend Growth Fund (IQDG), which has the same stocks as its currency-hedged “cousin,” IHDG (the WisdomTree International Hedged Quality Dividend Growth Fund.
The international strategies all score highly on profit margins (A), have more efficient asset usage (B) and engage lower levels of leverage (C). This combination indicates implied dividend growth that exceeds their respective benchmarks, maybe with lower risk.
Figure 4: Implied Dividend Growth Rate, International Strategies
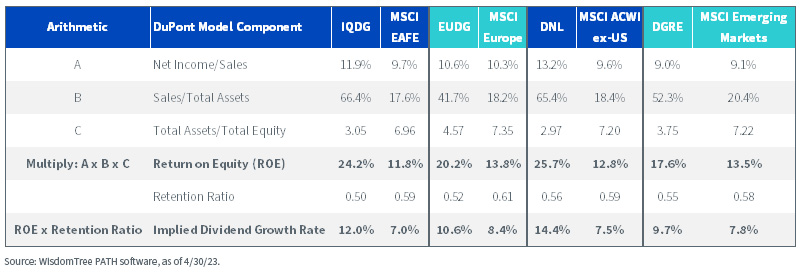
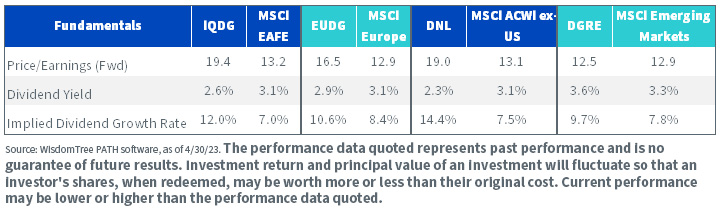
Figure 5 reproduces the fundamentals table for some of the international strategies.
Figure 5: Quality Dividend Growth Fundamentals
For the most recent month-end and standardized performance, SEC Standardized Yield, and fund holdings, click here: IQDG, EUDG, DNL, DGRE.
Happy 10th Birthday, DGRW
The last 10 years have been good ones for the Fund, as have the timeframes since. On June 1, 2023, it ranked in the 14th percentile of 1,410 funds in the Large Blend Morningstar peer group for the last year; in the 11th percentile of the group’s 1,273 funds for the last three years; in the 13th percentile of 1,172 funds for the last five years; and in the sixth percentile of 870 funds for the last 10 years. Its 12.0% return from its May 22, 2013, inception to the end of May 2023 has also edged out the S&P 500’s 11.9% run, with lower volatility.
Important Disclosures and Risks Related to this Article
Morningstar percentile rankings are based on a fund's average annual total return relative to all funds in the same Morningstar category, which includes both mutual funds and ETFs, and does not include the effect of sales charges. Fund performance used within the ranking, reflects certain fee waivers, without which, returns and Morningstar rankings would have been lower. The highest (or most favorable) percentile rank is 1 and the lowest (or least favorable) percentile rank is 100. Past performance does not guarantee future results.
Morningstar, Inc. All Rights Reserved. The information herein: (1) is proprietary to Morningstar and/or its content providers; (2) may not be copied or distributed; and (3) is not warranted to be accurate, complete or timely. Neither Morningstar nor its content providers are responsible for any damages or losses arising from any use of this information.
DGRW, DGRS, DNL, DGRE: There are risks associated with investing, including the possible loss of principal. Funds focusing their investments on certain sectors increase their vulnerability to any single economic or regulatory development. This may result in greater share price volatility. Dividends are not guaranteed, and a company currently paying dividends may cease paying dividends at any time. Please read each Fund’s prospectus for specific details regarding the Fund’s risk profile.
IQDG: There are risks associated with investing, including the possible loss of principal. Foreign investing involves special risks, such as risk of loss from currency fluctuation or political or economic uncertainty. Heightened sector exposure increases the Fund’s vulnerability to any single economic, regulatory or other development impacting that sector. This may result in greater share price volatility. The Fund invests in the securities included in, or representative of, its Index regardless of their investment merit, and the Fund does not attempt to outperform its Index or take defensive positions in declining markets. Due to the investment strategy of this Fund, it may make higher capital gain distributions than other ETFs. Dividends are not guaranteed, and a company currently paying dividends may cease paying dividends at any time. Please read the Fund’s prospectus for specific details regarding the Fund’s risk profile.
EUDG: There are risks associated with investing, including the possible loss of principal. Foreign investing involves special risks, such as risk of loss from currency fluctuation or political or economic uncertainty. This Fund focuses its investments in Europe, thereby increasing the impact of events and developments associated with the region, which can adversely affect performance. Dividends are not guaranteed and a company currently paying dividends may cease paying dividends at any time. Investments in currency involve additional special risks, such as credit risk and interest rate fluctuations. As this Fund can have a high concentration in some issuers, the Fund can be adversely impacted by changes affecting those issuers. The Fund invests in the securities included in, or representative of, its Index regardless of their investment merit and the Fund does not attempt to outperform its Index or take defensive positions in declining markets. Please read the Fund’s prospectus for specific details regarding the Fund’s risk profile.
Related Content
Share & Comment
Popular Posts
Categories
Related Links