
1H23 Saw Narrow Equity Market Leadership…So What?


A small subset of mega-cap companies—many of them associated with generative artificial intelligence—have driven most of the U.S. equity market’s positive returns in 2023.
So what?
Investors now are trying to decide if the growth setback in 2022 is indicative of a longer-term shift toward value investing over the coming years—or even decade—or if this was just a temporary speed bump for the large tech giants.
This year is also showing there is a wide dispersion of returns across the standard index providers’ definitions of growth and value—and we think this serves as a good case study for the choices made in portfolio construction.
What is growth? What is value? And how concerned should you be about valuations in each of these approaches? These are questions we explore below.
Notably, the S&P 500 Value Index’s compositional change in December 2022 highlights these nuanced strategies.
In 2023, Has ‘Growth’ Really Meant Growth?
While growth stocks beat value stocks this year, different constructs of “growth” have wide variation—selection rules and composition under the hood mattered.
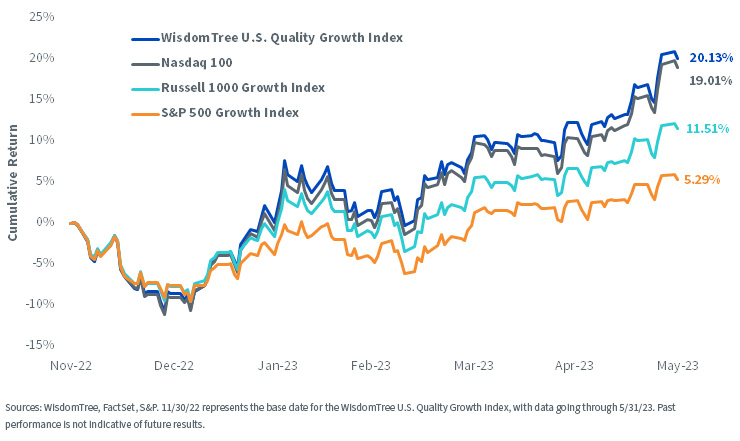
We see in figure 1 over a relatively short six-month time frame:
- The WisdomTree U.S. Quality Growth Index delivered a similar return to that of the Nasdaq 100 Index. While not a dedicated growth style per se, since the global financial crisis of 2008–2009, the Nasdaq 100 has been one of the most widely followed equity benchmarks for growth or tech investors.
- The Russell 1000 Growth Index was unable to match the returns of either the WisdomTree U.S. Quality Growth Index or the Nasdaq 100 Index, but it delivered more than twice the cumulative return of the S&P 500 Growth Index.
Bottom line: What is the appropriate measure of growth equity returns? It appears these four indexes, at a minimum, have very different overall constructions.
Figure 1: The Battle of the Growth Indexes
What about Value?
The value factor generated a lot of attention during 2022, as the long-duration tech stocks with the highest multiples sold off the most.
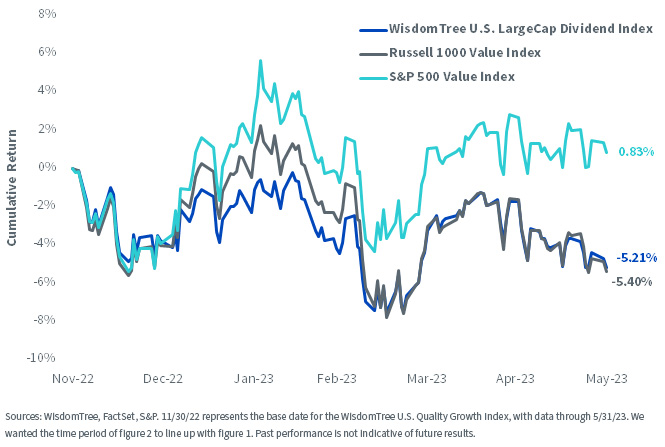
Market leadership in 2023 has been anything but value. However, we see a similar issue as with the growth style: different indexes built to capture value are exhibiting quite different outcomes.
- The WisdomTree U.S. LargeCap Dividend Index focuses on dividend-paying stocks, weighted on the basis of their cash dividends, and this methodology has a longstanding association with the value factor. We see here that the return of this WisdomTree Index was very similar to that of the Russell 1000 Value Index over this period.
- The S&P 500 Value Index starts off the time period with similar performance to the other two indexes in figure 2, but then it begins to diverge, ultimately showing a separation of more than 6% in cumulative return terms.
Bottom line: Again, we ask, what is the appropriate encapsulation of value? Are the WisdomTree U.S. LargeCap Dividend and Russell 1000 Value indexes dramatically underperforming, or is something unique happening within the S&P 500 Value Index?
Figure 2: The Battle of the Value Indexes
Do You Know How to Separate Value and Growth Stocks?
One detailed point in index methodologies that surprises some: the same stock can be in BOTH the value and the growth index.
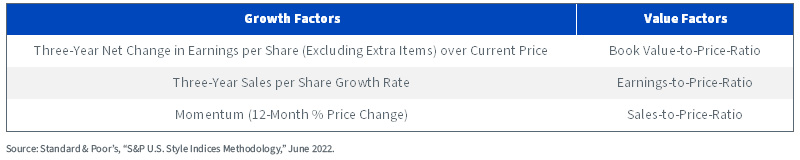
A second detail that can surprise investors is that the S&P 500 Value and Growth indexes incorporate a momentum measure within the list of three growth factors. The list of value and growth factors used to denote value and growth is shown in figure 3.
We note the following:
- Fundamental data can certainly change, but the volatility of these changes in a single year tends to be more muted—especially when ranked against the changes of other, similarly large firms.
- Price data, particularly based on a 12-month percentage price change (12-Month % Price Change), has much higher volatility. Stocks with higher long-run earnings and sales growth may see a period (like 2022) with a terrible 12-Month % Price Change, even if their other two growth metrics, measured as three-year figures, don’t change much.
Figure 3: Factors that S&P Uses to Denote Value and Growth Equities
The Russell indexes, surprise, surprise, look at different variables, noted below:
- Russell 1000 Growth Fundamentals: 1) I/B/E/S forecast medium-term growth (2 year) and, 2) sales-per-share historical growth (5 year).
- Russell 1000 Value Fundamentals: Solely the book value-to-price ratio.
So the fact that S&P is using momentum, specifically 12-Month % Price Change, as a growth factor stands out in that it is based on a direct measure of price change.
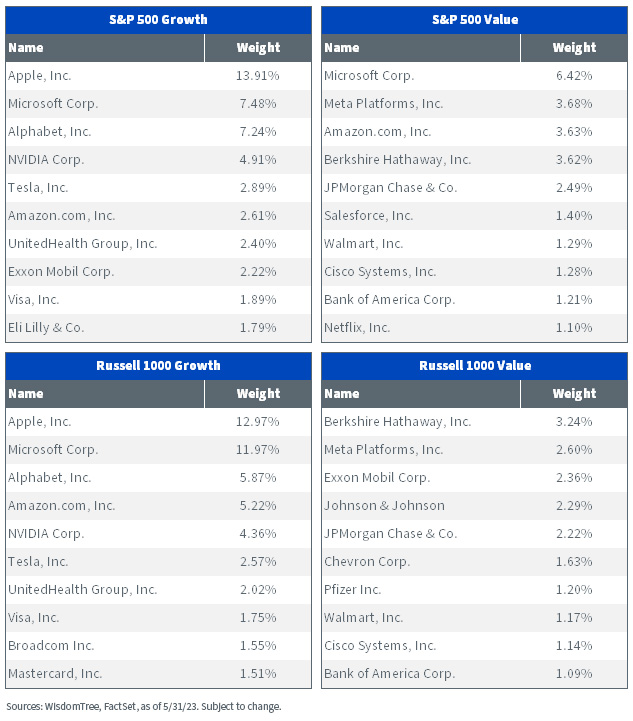
We see the result of all of this clearly in figure 41, where something different has been going on for about six months within the S&P 500 Value and Growth indexes.
- Microsoft was the second-largest holding in the S&P 500 Growth Index and the top holding in the S&P 500 Value Index. The company was weighted similarly in each index as of this date.
- Amazon.com was the sixth-largest holding in the S&P 500 Growth Index and the third-largest holding in the S&P 500 Value Index.
- Amazon was actually weighted more highly in the value index.
- Amazon and Microsoft had been in some of the pre-eminent growth indexes for the last decade yet showed up in value due to their underperformance—not because they were cheap stocks on an absolute basis. Nothing even remotely like this had happened within the top 10 of the Russell 1000 Value and Growth indexes.
Figure 4: A Comparison of Top 10 Lists Provides Clarity on S&P vs. Russell
Conclusion: Narrow Market Leadership Maximizes the Effect
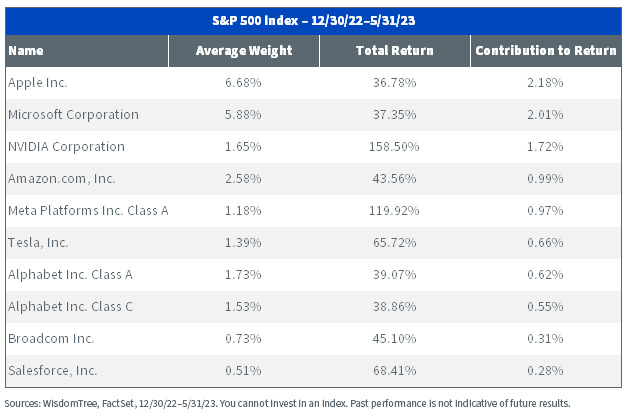
Another element that we might not have expected in 2023 was that a narrow subset of stocks in the S&P 500, largely associated with tech or even more specifically artificial intelligence, would drive the entire benchmark index return. We see the list in figure 5:
- These 10 stocks contributed 10.28% of return to the overall S&P 500.
- Since the full index return for this period was 9.65%, that means the other stocks (roughly 490 or so) actually detracted from the index’s total return.
Figure 5: 10 Stocks Driving the S&P 500 Index for the First Five Months of 2023
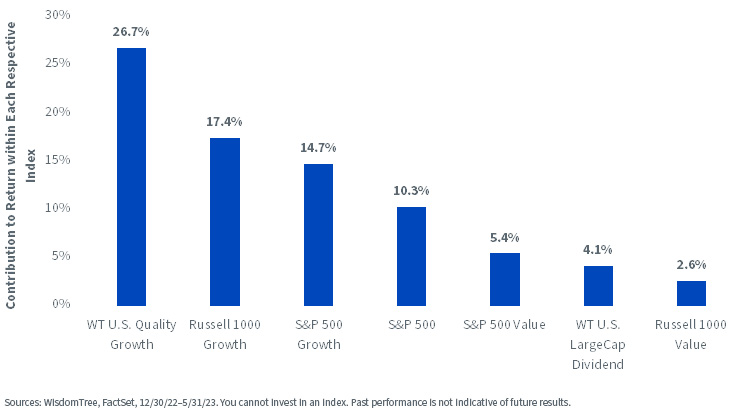
The final figure brings it all together to indicate the contribution to returns coming from these 10 mega-cap stocks in each of the indexes we have studied in this piece.2
The WisdomTree U.S. Quality Growth Index was IDEALLY positioned for the first half of 2023, at least as of this writing. It found and positioned significant weight in the stocks most responsible for driving the S&P 500 forward. Those who are thinking the second half of 2023 will be more of the same should study this Index further. It selects companies with high returns on capital and profitability with strong forward-looking earnings growth expectations.
- The WisdomTree U.S. LargeCap Dividend and Russell 1000 Value indexes had the lowest exposures to these stocks, and therefore saw the lowest contribution to total returns from them. However, this is useful, in that investors who believe the growth rally is getting over-extended may want to study exposures that are genuinely different.
Bottom line: When positioning a portfolio, a greater difference is your friend in that it allows you to both have a view and use a tool that is really taking that particular stand. The S&P 500, in the middle, represents the ‘no-view’ type of positioning, and many people who sit there tend to want a passive approach at the lowest possible cost.
Figure 6: Contribution to Returns, by Index, from the Stocks Driving the S&P 500 in the First Five Months of 2023
We believe that this is an important topic and in our next analysis, we are going to look at what all the above means from a valuation perspective, in that if investors are looking for an index to have a valuation discount against a core option (i.e., S&P 500 Value vs. S&P 500), it is tougher to do this IF the value index is including growth stocks.
1 Index constituents weight discussed as of 5/31/23.
2 We do no have access to index constituents of the Nasdaq 100 to create this analysis.
Share & Comment
Popular Posts
Categories
Related Links
Christopher Gannatti began at WisdomTree as a Research Analyst in December 2010, working directly with Jeremy Schwartz, CFA®, Director of Research. In January of 2014, he was promoted to Associate Director of Research where he was responsible to lead different groups of analysts and strategists within the broader Research team at WisdomTree. In February of 2018, Christopher was promoted to Head of Research, Europe, where he was based out of WisdomTree’s London office and was responsible for the full WisdomTree research effort within the European market, as well as supporting the UCITs platform globally. In November 2021, Christopher was promoted to Global Head of Research, now responsible for numerous communications on investment strategy globally, particularly in the thematic equity space. Christopher came to WisdomTree from Lord Abbett, where he worked for four and a half years as a Regional Consultant. He received his MBA in Quantitative Finance, Accounting, and Economics from NYU’s Stern School of Business in 2010, and he received his bachelor’s degree from Colgate University in Economics in 2006. Christopher is a holder of the Chartered Financial Analyst Designation.