
Improving Risk-Adjusted Returns with U.S. Quality Dividend Growth
Published January 3, 2024

Head of Indexes, U.S.
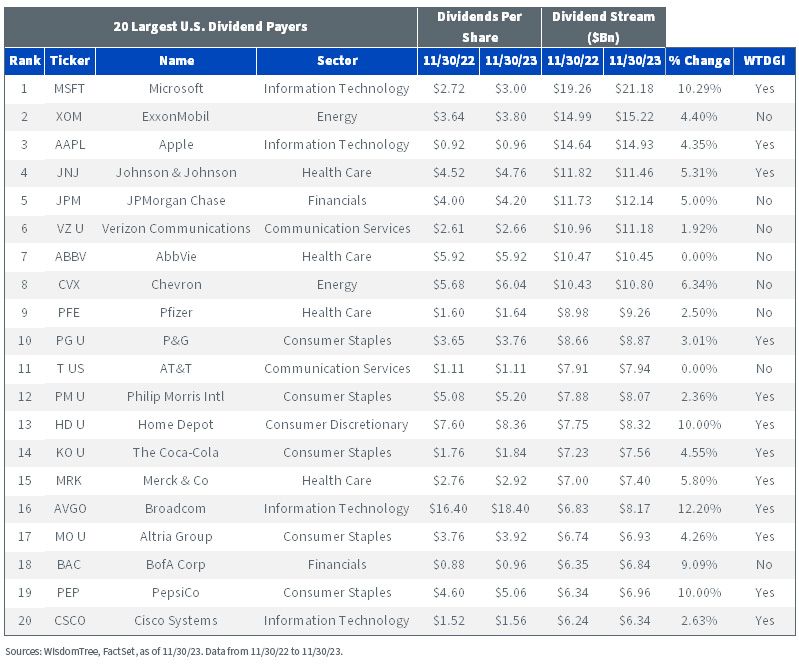
In a year of moderate economic growth, cash dividend payouts have also grown at a steady pace. The U.S. Dividend Stream®, which sums the indicated dividend payments of all U.S. listed payers, has grown at a 5.4% rate over the previous 12 months, close to the 5.8% annual figure since 2007.1
Of the 20 largest dividend payers in the U.S. market, 18 have grown their payments this year. The WisdomTree U.S. Quality Dividend Growth Index (WTDGI) held 12 out of these 18 securities in 2023, which contributed to its dividend growth of 6.6% exceeding the broad U.S. market by north of 1%. It is important to highlight how WTDGI did not hold the only two non-growers, AbbVie and AT&T.
The WisdomTree U.S. Quality Dividend Growth Index (WTDGI), tracked by the WisdomTree U.S. Quality Dividend Growth Fund (DGRW), selects companies that look attractive across measures of profitability, like ROE and ROA, and earnings growth prospects and weights them by their Dividend Stream. As highlighted above, this fundamental model has allowed WTDGI to gain exposure to dividend growers and stay away from companies at risk of cutting or suspending dividend payments.
Improving Risk-Adjusted Return of a Core Allocation
In a post we wrote to celebrate WTDGI’s 10-year anniversary last year, we highlighted how since its inception in 2013, WTDGI has managed to outperform the S&P 500 by about 40 basis points annually and do so with 1.3% lower volatility.
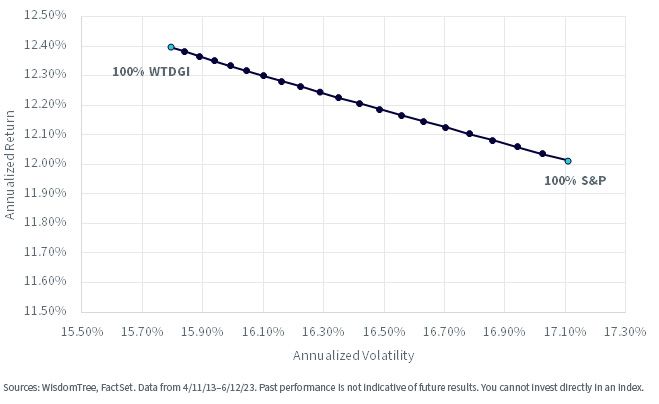
The efficient frontier below shows the annualized return and volatility of portfolios built by combining WTDGI and S&P 500. The data used for this chart stems from April 11, 2013, to December 6, 2023, and assumes that the allocation is rebalanced semiannually at the end of April and October. Each dot on the curve shows a 5% shift in allocation from one asset to the other.
Given their high correlation, which ranges from 0.91 to 0.99 in rolling one-year periods, it is not surprising to see the straight-line nature of the efficient frontier rather than the typical curve of lower correlation assets. This being said, it is important to highlight how combining these two would’ve helped investors reduce volatility without coming at the cost of performance or, rather, also be a benefit in performance.
Asset Allocation: WTDGI vs. S&P 500
Index Methodology
The methodology of WTDGI’s annual rebalance, which happened on December 13, can be explained in the following stages:
- Starting Universe: The Index’s starting universe consists of dividend-paying U.S. equities that meet WisdomTree’s liquidity requirements and whose market caps exceed $2 billion. Companies whose dividend coverage ratios are less than 1 (i.e., dividends exceed earnings) are removed, as are companies flagged as risky by WisdomTree’s composite risk score (CRS).
- Composite Score Selection: Companies are then ranked based on an equally weighted composite score of growth and quality. Growth is defined as consensus estimated earnings growth over the next one to three years, while quality is calculated as a 50/50 score of the company’s average three-year ROE and ROA. The top 300 companies are selected into the portfolio.
- Final Portfolio: The 300 companies selected are Dividend-Stream-weighted to reflect the proportionate share of aggregate cash dividends. An individual holding cap of 8% is applied prior to a 20% sector cap for all sectors except Info. Tech. (30%) and Real Estate (10%).
The chart below highlights the different stages of WTDGI’s latest rebalance in December 2023 and compares portfolio characteristics versus those of the S&P 500 Index (teal).
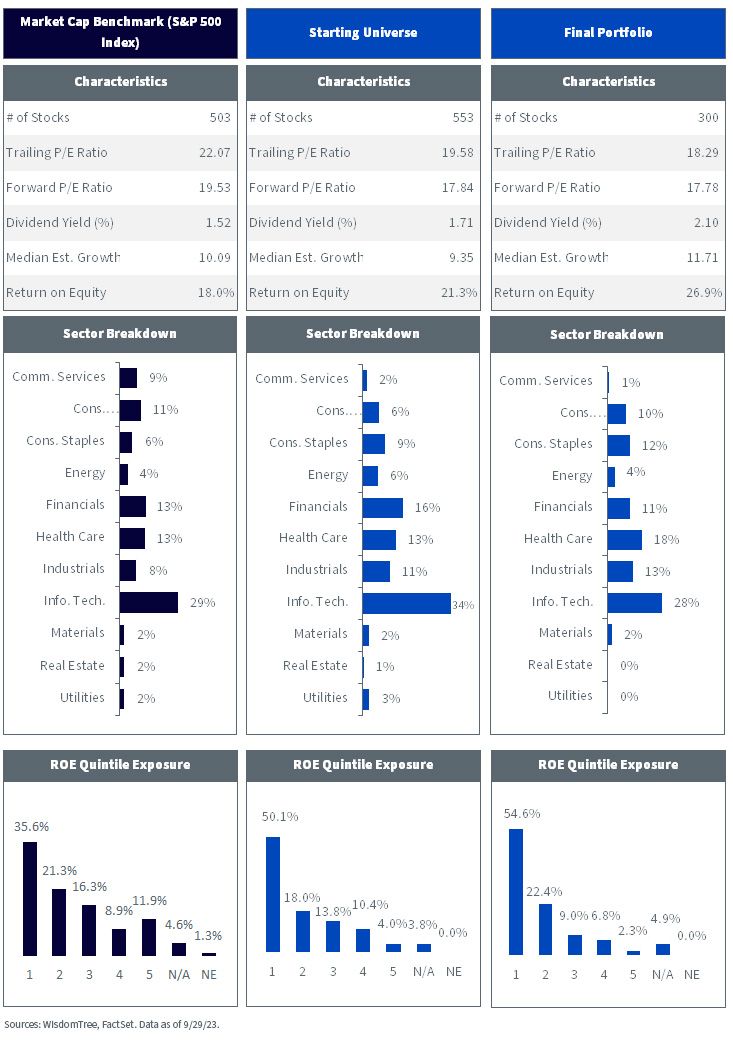
For definitions of terms in the figure above, please visit the glossary.
Rebalance Highlights
WTDGI’s starting universe already shows a quality tilt and improving valuation coming from removing non-dividend payers and companies whose dividends exceed earnings or are at risk of cutting their dividend payments.
Upon selecting the 300 best-scoring companies on the composite score of growth and quality and Dividend-Stream-weighting the basket, the portfolio exhibits stronger quality and growth characteristics. Aggregate ROE exceeds the S&P 500 by almost 9%, and the median estimated growth of the portfolio is 1.5% higher.
More than half of the weight is allocated to the highest ROE companies. Both the trailing and forward valuations of the portfolio are lower than the S&P 500, showing how this process can achieve its tilts by keeping valuations in check and having a higher dividend yield than the market.
Sectors like Consumer Staples, Health Care and Industrials are over-weight while Comm. Services and Utilities are under-weight.
DGRW: The ETF That Tracks WTDGI
DGRW has been a favored ETF for core exposure to the market, and outperforming the S&P 500 with lower volatility has been a prime feature. Selecting only companies we see as best positioned to deliver dividend growth has led this ETF to have a smoother ride than core indexes with the more volatile non-dividend-paying stocks. Whether you want some value exposure or growth exposure, DGRW plays down the middle, trying to bring elements of selecting high-quality growth stocks but with a dividend and valuation framework involved in weighting.
1 Sources: WisdomTree, MSCI. Data from 11/30/07–11/30/23.
Important Risks Related to this Article
There are risks associated with investing, including the possible loss of principal. Funds focusing their investments on certain sectors increase their vulnerability to any single economic or regulatory development. This may result in greater share price volatility. Dividends are not guaranteed, and a company currently paying dividends may cease paying dividends at any time. Please read the Fund’s prospectus for specific details regarding the Fund’s risk profile.
About the contributor

Head of Indexes, U.S.
Alejandro Saltiel joined WisdomTree in May 2017 as part of the Quantitative Research team. Alejandro oversees the firm’s Equity indexes and actively managed ETFs. He is also involved in the design and analysis of new and existing strategies. Alejandro leads the quantitative analysis efforts across equities and alternatives and contributes to the firm’s website tools and model portfolio infrastructure. Prior to joining WisdomTree, Alejandro worked at HSBC Asset Management’s Mexico City office as Portfolio Manager for multi-asset mutual funds. Alejandro received his Master’s in Financial Engineering degree from Columbia University in 2017 and a Bachelor’s in Engineering degree from the Instituto Tecnológico Autónomo de México (ITAM) in 2010. He is a holder of the Chartered Financial Analyst designation.