

Have Inverted Yield Curves Lost Their Way?
Published October 18, 2023

Kevin Flanagan
Head of Investment and Fixed Income Strategy
With all the attention given to the recent surge in Treasury (UST) yields, there has been an interesting by-product in the process: steepening yield curves. Remember when inverted yield curves were all the rage, and their historical track record was being highlighted as a sure sign of an eventual recession? Well, here we are, many months since the curves went into negative territory, but as yet, still no recession. Does that mean inverted curves have lost their way?
U.S. Treasury Yield Curves
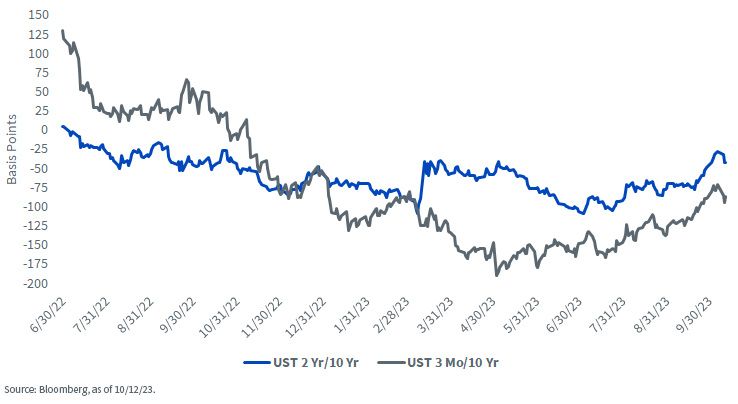
Let’s take a look at the two most widely followed yield constructs: UST 3mo/10yr and UST 2yr/10yr. Both these curves went into inverted, or negative, territory last year, but at different times. The 2yr/10yr spread moved below zero consistently at the end of June, while the 3mo/10yr differential hit the minus column during the fall of 2022.
Since then, both these constructs had been on a one-way trip into deeper and deeper negative territory. Indeed, the degree of inversion has been historical in nature, with the 2s/10s dropping to a nadir of -109 basis points (bps) in March and the 3mo/10yr plunging to its low point of -191 bps in May. While Treasury yields in general have been on the rise, the inverted nature of the curves was due primarily to the Fed’s Volcker-esque rate hikes. Indeed, the policy makers were pushing the Fed Funds target range up to levels not seen since the early 2000s, raising short-term rates such as the 3-month t-bill and the UST 2-Year note along with it. Meanwhile, the increase in the 10-Year yield could not keep pace…hence the deep inversions.
Now let’s fast forward to the present. While the Fed has been keeping the Fed Funds target range at 5.25%–5.50%, the 10-Year yield has surged. To provide some perspective, the UST 10-Year has experienced a roughly 100 bps increase since mid-July, with 60–70 bps of this rise occurring within the last six weeks. As a result, the aforementioned yield curves have steepened dramatically. For example, the 2s/10s inversion shrunk by 80 bps to only -28 bps following the jobs report, while the 3mo/10yr negative spread had re-steepened by an incredible 120 bps to -71 bps.
Back to the inverted yield curves’ forecast ability. A lot has been written about the impressive track record of inverted yield curves predicting past recessions. As a student of history, one needs to respect that. Interestingly, the U.S. economy did post back-to-back negative real GDP readings during Q1 and Q2 last year. However, that was prior to the curves discussed here going negative.
Conclusion
Where does that leave us, looking ahead? Well, as I mentioned in the opening, the U.S. economy has thus far avoided a downturn, and available data suggests a recession does not appear to be imminent either. So, just like a lot of other things lately, where the timing keeps getting pushed back, could a negative quarter or two of real GDP become a 2024 development? Even though Treasury yield curves have dramatically steepened, the two constructs highlighted in this blog post still remain inverted and past Fed tightening policies rarely achieved a soft landing. To quote Yogi Berra, “it ain’t over till it’s over.”
Categories
Related articles
Closing the Curtain on Rate Cuts
A ‘Warsh’ Out at the Fed

Fed Watch: The Changing of the Guard Finally Arrives
Private Credit Beyond the Headlines: Why Diversification and Liquidity Matter More Than Ever
Are Bessent’s Hands Tied?
‘Warsh’ and Dry

What’s ‘Under the Hood’ of Your Core Bond Position?

Powell Stays…Should the Dot Plot?

Fed Watch: Powell’s Last Stand & What Comes Next?
About the contributor

Kevin Flanagan
Head of Investment and Fixed Income Strategy
Kevin serves as the Head of Investment and Fixed Income Strategy. In this role, he writes macro and fixed income-related content and works closely with the sales, research and marketing teams. In addition, Kevin conducts client-facing webinars and meetings, providing expertise on WisdomTree’s existing and future bond ETFs. Prior to joining WisdomTree, Kevin spent 30 years at Morgan Stanley, where he was Managing Director and Chief Fixed Income Strategist for Wealth Management. He was responsible for tactical and strategic recommendations and created asset allocation models for fixed income securities. He was a contributor to the Morgan Stanley Wealth Management Global Investment Committee, primary author of Morgan Stanley Wealth Management’s monthly and weekly fixed income publications, and collaborated with the firm’s Research and Consulting Group Divisions to build ETF and fund manager asset allocation models. Kevin has an MBA from Pace University’s Lubin Graduate School of Business, and a B.S. in Finance from Fairfield University.