

Inverted Yield Curves Reach New Heights…or Is it Lows
Published February 15, 2023

Kevin Flanagan
Head of Investment and Fixed Income Strategy
What happens when the Fed raises rates by 450 basis points (bps)? Ok, easy question, the answer: inverted yield curves. I’ve touched upon this topic in the past, but thought it would be a good idea to bring the reader up to date. Based upon arguably the two most closely watched yield curve gauges, the Treasury 3-Month/10-Year and Treasury 2-Year/10-Year spreads, the degree of inversion has now either set a record or is at its most negative differential in over 40 years.
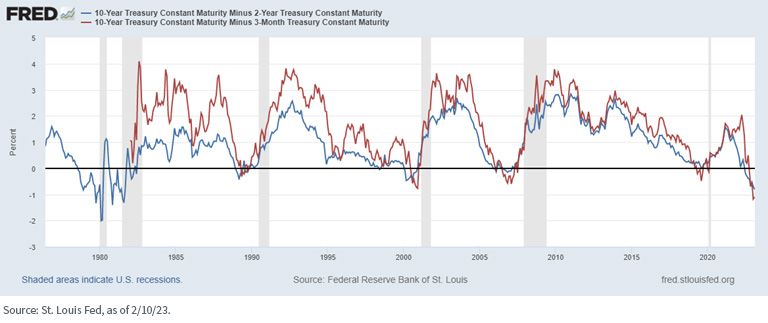
So, why is this historical inversion of importance? In the past, as the graph clearly illustrates, when the two spreads have moved into negative territory, it was a precursor to a recession. While the time lapse between these yield curves going into the minus column and an economic contraction actually taking place varied, the end result was unmistakably the same: a recession.
U.S. Treasury Yield Curves
In prior blog posts on the topic at hand, I readily acknowledged the past relationship between inversions and recessions, but opined that, going forward, some nuances could render future predictability a little less straightforward. Specifically, the role of quantitative easing (QE) stood out front and center. In prior episodes, the Treasury (UST) market was not under the spell of the Fed’s QE program. The jury is still out on whether the yield curve inversions of 2019 would have led to a recession without the adverse impacts of the COVID-related lockdowns.
So, let’s focus on the current state of the yield curve. Getting back to the potential effects of QE on the curve, my argument centered along the lines that perhaps we would need to see a deeper and longer-lasting inverted situation than had been the case in the past. Even some Fed officials made a similar case. From a ‘length’ perspective, the inverted nature of the curves highlighted here are either at, or close to, what we have seen in the past. It’s the magnitude of the negative spreads that really stands out. To elaborate on the historical ground we are now in, the UST 3-Month/10-Year spread reached as wide as -132 bps in mid-January while the 2-Year/10-Year differential got to as high/low as -84 bps in December. Presently, both gauges are still at historically inverted readings of -105 bps and -77 bps, respectively. Just sticking with the 3-Month/10-Year curve for some perspective, the peak negative reading during the 2006/07 episode was -62 bps and for the 2000/01 period, the high watermark was -82 bps.
Conclusion
Now for the $64,000 question (not adjusted for inflation). Is a recession inevitable given the inverted nature of the UST yield curve? If history is any guide, one would come to the conclusion the U.S. economy is headed toward contractionary territory, it’s just a matter of when. Looking at economists’ estimates for Q1 real GDP, the recession may have to wait. In fact, the Atlanta Fed’s GDPNow forecast has the economy growing by 2.1% in Q1, as of this writing. The recent blockbuster jobs report has also created a narrative that perhaps the Fed can achieve the ever-elusive ‘soft landing.’ However, as I write this blog post, the consensus is still projecting negative GDP to show up in the second and third quarters of this year. Just another factor to keep volatility elevated for the money and bond markets!
Categories
Related articles
A ‘Warsh’ Out at the Fed

Fed Watch: The Changing of the Guard Finally Arrives
Private Credit Beyond the Headlines: Why Diversification and Liquidity Matter More Than Ever
Are Bessent’s Hands Tied?
‘Warsh’ and Dry

What’s ‘Under the Hood’ of Your Core Bond Position?

Powell Stays…Should the Dot Plot?

Fed Watch: Powell’s Last Stand & What Comes Next?
Inflation’s First Official Debut
About the contributor

Kevin Flanagan
Head of Investment and Fixed Income Strategy
Kevin serves as the Head of Investment and Fixed Income Strategy. In this role, he writes macro and fixed income-related content and works closely with the sales, research and marketing teams. In addition, Kevin conducts client-facing webinars and meetings, providing expertise on WisdomTree’s existing and future bond ETFs. Prior to joining WisdomTree, Kevin spent 30 years at Morgan Stanley, where he was Managing Director and Chief Fixed Income Strategist for Wealth Management. He was responsible for tactical and strategic recommendations and created asset allocation models for fixed income securities. He was a contributor to the Morgan Stanley Wealth Management Global Investment Committee, primary author of Morgan Stanley Wealth Management’s monthly and weekly fixed income publications, and collaborated with the firm’s Research and Consulting Group Divisions to build ETF and fund manager asset allocation models. Kevin has an MBA from Pace University’s Lubin Graduate School of Business, and a B.S. in Finance from Fairfield University.