
Speculative Growth Companies Help Drive Exposures in Mid-Cap and Small-Cap Earnings Indexes


The COVID-19 pandemic period highlighted the contrast between speculative companies—in many cases, earlier in their life cycles—and more established, longstanding companies.
To us, a quintessential quality of a “speculative” stock is that it has no profits, and the path to profitability could be years away. That doesn’t imply a negative view—people are likely familiar with the history of Amazon.com’s profitability (or lack thereof) for many years. Rather, one must set expectations differently when dealing with stocks that are not yet profitable.
In 2020, speculative stocks with potential profitability years and years into the future performed remarkably well. We believe this was driven by:
- Extremely low cost of capital—If resources are easier to get, and money sitting in cash is earning basically nothing, this encourages investors to take more risks and companies to spend more money. Some of that spending might be good…and some of it might not.
- Extremely high liquidity—many people received direct deposits from the government into their bank accounts. Since they could not go out and spend it due to pandemic lockdowns, many of them used applications like Robinhood to invest in different kinds of assets. It felt like there was almost a “lottery-like” methodology being applied to markets and asset class behavior.
Small-cap and mid-cap growth companies, in particular, did generally very well during this period, and it is helpful to understand the general exposure of unprofitable companies that exist in major mid-cap and small-cap indexes and how this exposure looks when broken down by sector.
Similarly, 2022 was the opposite in many ways of 2020, where those same types of companies, driven higher by the conditions imposed by the pandemic, responded poorly to the higher inflation and central bank tightening.
Figures 1a and 1b clearly note that growth indexes led in small caps and mid-caps during 2020 but then subsequently lagged in 2022.
WisdomTree’s two strategies focused on profitable companies in mid-caps and small caps tilted more toward the value style than the growth style, given requirements for profitability at inclusion and a weighting that rewards lower-valuation stocks.
Figure 1a: Growth Indexes Led in Mid-Caps and Small Caps during 2020
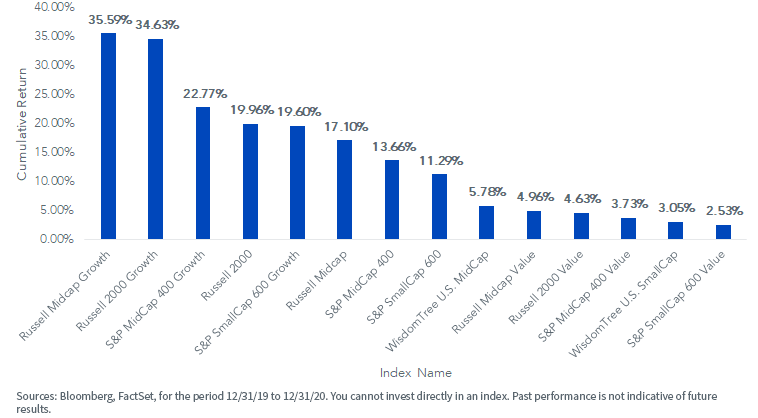
For definitions of all terms in the charts, please visit our glossary.
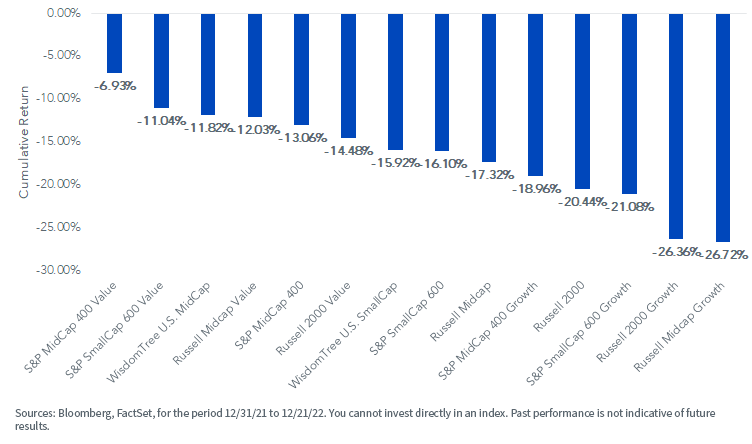
During the tougher market condition of 2022, the value side of the ledger led the way.
Figure 1b: Value Strategies Tended toward Less Negative Returns Than Growth Strategies in 2022
Quantifying the Opportunity Cost of Choosing Value or Growth in Mid- and Small Caps
Investing is about decisions at its core. Do you lean toward value, growth or strategies that straddle between the two to mitigate the risk of choosing incorrectly?
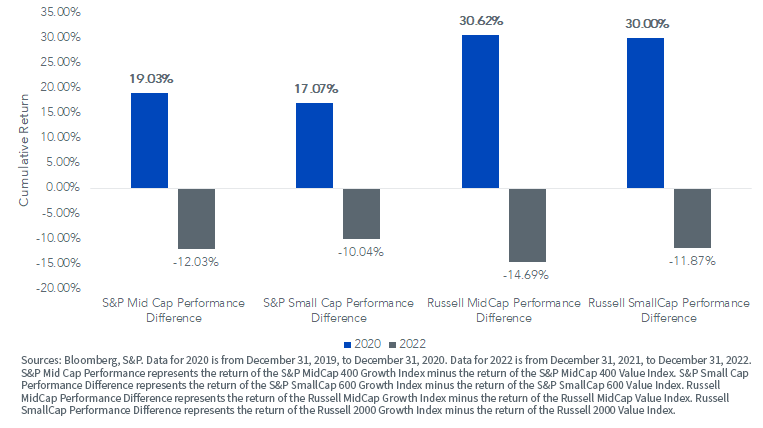
Figure 2 showcases the return of the growth index and subtracts the return of the value index—a positive number means “growth outperformance,” and a negative number means “growth underperformance.”
- In mid-caps, there was a difference in return of 19.03% in 2020, meaning that the S&P MidCap 400 Growth Index outperformed the S&P MidCap 400 Value Index by this amount.
- The Russell MidCap Growth Index outperformed the Russell MidCap Value Index by more than 30.6%—significantly more.
- The S&P family requires a demonstration of profitability on initial index inclusion, whereas Russell’s approach does not focus on this in the same manner, leading Russell indexes to generally have more exposure to speculative companies than S&P—and this benefited Russell’s growth indexes in 2020.
- It was similar within small caps. The S&P SmallCap 600 Growth Index outperformed the S&P SmallCap 600 Value Index by 17.07%, while the Russell 2000 Growth Index outperformed the Russell 2000 Value Index by 30.00% over the same 2020 period. Russell’s approach to growth investing benefited from higher returns and more speculative company exposures in 2020.
- 2022 saw the opposite. Across the board, growth underperformed value. However, the differences between S&P and Russell were much smaller in 2022 than they were in 2020, meaning that S&P’s value indexes outperformed S&P’s growth indexes by similar magnitudes as Russell’s value indexes outperformed Russell’s growth indexes.
It seemed to have been better to choose a Russell growth index in those two unique years when speculative stocks performed well, but in 2022, when value outperformed growth, it mattered less whether one selected a Russell or an S&P variant—the key decision to make was “value” over “growth” for these indexes during 2022.
Figure 2: Russell Indexes Tended toward Greater Exposure to Speculative Companies in 2020
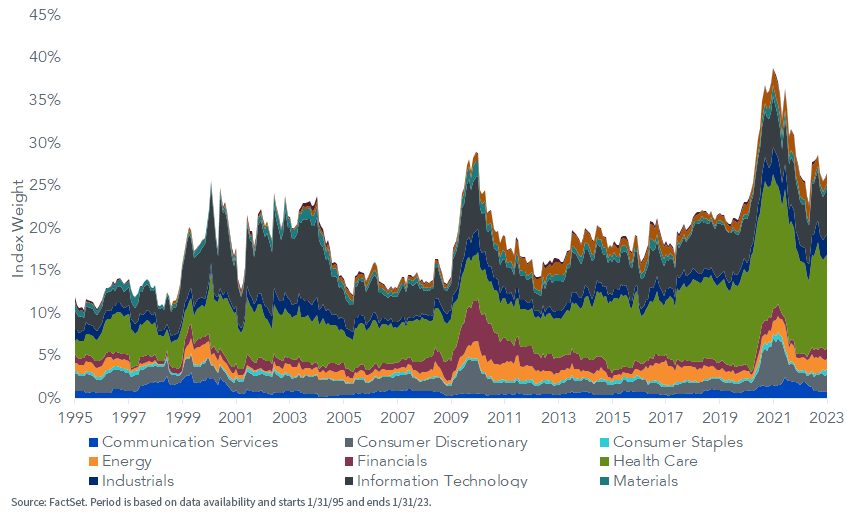
Where Are the Unprofitable Mid-Cap Companies—Analysis of the Russell MidCap Index by Sector
Looking at the exposure of the Russell MidCap Index to companies with negative earnings, the first thing that jumps out in figure 3 is that the exposure is not constant. From 1995 to 2023, we see three distinct spikes above 15%, which were associated with 1) the bursting of the “tech bubble,” 2) the global financial crisis of 2008–2009 and 3) the period immediately following the outbreak of COVID-19.
Over time, it was also clear that even if different sectors rise and fall with respect to their exposure to unprofitable companies, the Information Technology sector has tended toward the largest exposure to unprofitable companies over the most sustained periods of time.
Figure 3: Evolution of Weight in Unprofitable Companies in the Russell MidCap Index, Arrayed by Sector
Mid-cap indexes are one area of the market with more speculative and unprofitable technology companies.
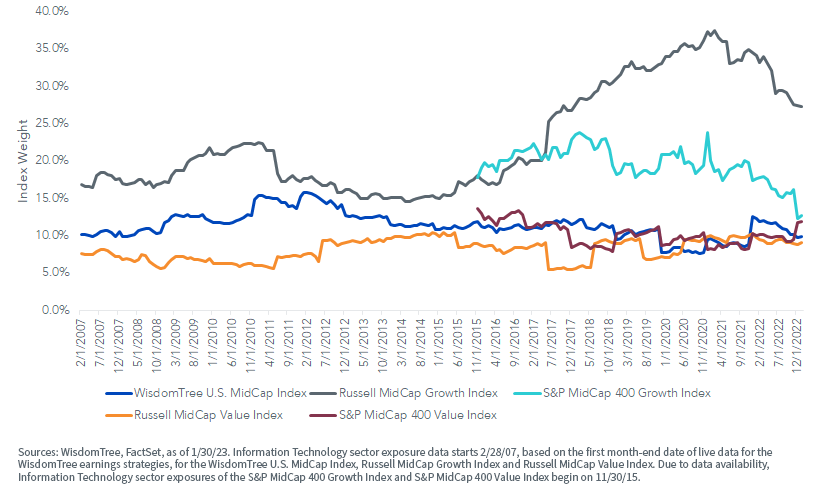
Figure 4 shows that the Russell MidCap Growth Index recently eclipsed 35% exposure to the Information Technology sector. This is neither good nor bad—it simply tells us that if we desire more speculative mid-cap equity exposure, this Index could be worth a look.
Figure 4 also shows that not all “growth”-oriented indexes are created equally. The difference in Information Technology sector weight between the Russell MidCap Growth and S&P MidCap 400 Growth Indexes is more than 10%. This is a good reason to expect a widely different performance between these two Indexes.
Mid-cap value indexes are quite different from their growth-oriented peers. Russell and S&P mid-caps have a much more similar overall exposure to the Information Technology sector—and it was much lower.
Earnings indexes are more value-like. We note further that the WisdomTree U.S. MidCap Index had an exposure to this sector that made it appear much more similar to “value” than to “growth.”
Figure 4: Information Technology Sector Exposure across Mid-Cap Indexes
And Now…Small Caps
We see in figure 5 the exposure of the Russell 2000 Index to companies with negative earnings. Similar to figure 1, the exposure is not constant. It is generally higher than what we saw with the Russell MidCap Index, and we see peaks around 1) the bursting of the tech bubble, 2) the global financial crisis of 2008–2009 and 3) the period directly after the outbreak of COVID-19.
What was also interesting about figure 5 was the overall contribution of the Health Care sector to the total exposure in more speculative, currently unprofitable companies. “Biotech” tends to ebb and flow in terms of attention, and those newer public companies partaking in speculative developments tend to find themselves in this Index.
Figure 5: Evolution of Weight in Unprofitable Companies in the Russell 2000 Index, Arrayed by Sector
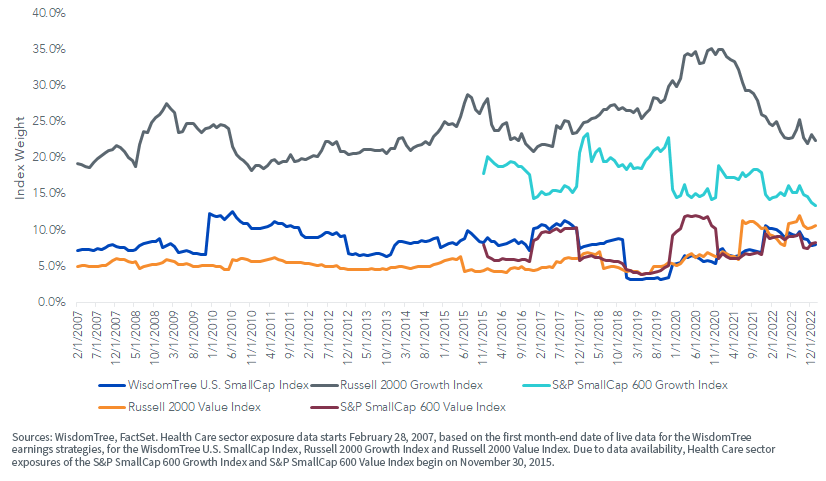
The Russell 2000 Growth Index’s exposure to the Health Care sector is quite different from the other Indexes shown in figure 6. While early 2023 doesn’t have it around 35%—the near-term high—it is much higher than all of the other Indexes shown, even the S&P SmallCap 600 Growth Index. The S&P SmallCap 600 Growth Index’s exposure to the Health Care sector is trending to levels that do not look largely different than the exposure in some of the value Indexes shown.
It’s quite clear that the WisdomTree U.S. SmallCap Index had exposure to the Health Care sector that looked much more similar to the value index benchmarks than the growth index benchmarks.
Figure 6: Health Care Sector Exposure across Small-Cap Indexes
Bottom Line: Value Appears Less Exposed to Speculative Companies Than Growth
As we start 2023, one of the critical decisions investors are making is how to play the potential “pivot” in strategy at the U.S. Federal Reserve—meaning that the market will adjust price levels as it receives more information about the future path of the policy rate—which may very well stop being hiked in the coming meetings.
If policy rate hikes stop before the market was otherwise expecting this action, it could relieve some pressure on more speculative, growth-oriented stocks.
But over time, WisdomTree believes the importance of valuations will re-assert and the risk to elevated multiples will still remain.
An “earnings-weighted” approach—exemplified by the WisdomTree U.S. MidCap Index and WisdomTree U.S. SmallCap Index—is not necessarily focused directly on “growth” or “value” in the methodology, but requiring companies to demonstrate positive earnings on an ongoing basis does lead to less exposure to speculative firms.
On a sector exposure basis—looking at Information Technology in mid-caps and Health Care in small caps shows that these strategies have more in common with the value benchmarks than the growth ones, and this could help investors build expectations about possible future behavior.
The first month of 2023 saw speculative growth winning, so we are off to the races with anything but a dull year seeming to be in store!
Share & Comment
Popular Posts
Categories
Related Links
Christopher Gannatti began at WisdomTree as a Research Analyst in December 2010, working directly with Jeremy Schwartz, CFA®, Director of Research. In January of 2014, he was promoted to Associate Director of Research where he was responsible to lead different groups of analysts and strategists within the broader Research team at WisdomTree. In February of 2018, Christopher was promoted to Head of Research, Europe, where he was based out of WisdomTree’s London office and was responsible for the full WisdomTree research effort within the European market, as well as supporting the UCITs platform globally. In November 2021, Christopher was promoted to Global Head of Research, now responsible for numerous communications on investment strategy globally, particularly in the thematic equity space. Christopher came to WisdomTree from Lord Abbett, where he worked for four and a half years as a Regional Consultant. He received his MBA in Quantitative Finance, Accounting, and Economics from NYU’s Stern School of Business in 2010, and he received his bachelor’s degree from Colgate University in Economics in 2006. Christopher is a holder of the Chartered Financial Analyst Designation.