
The 2021 Equity Equation: It’s All about Interest Rates


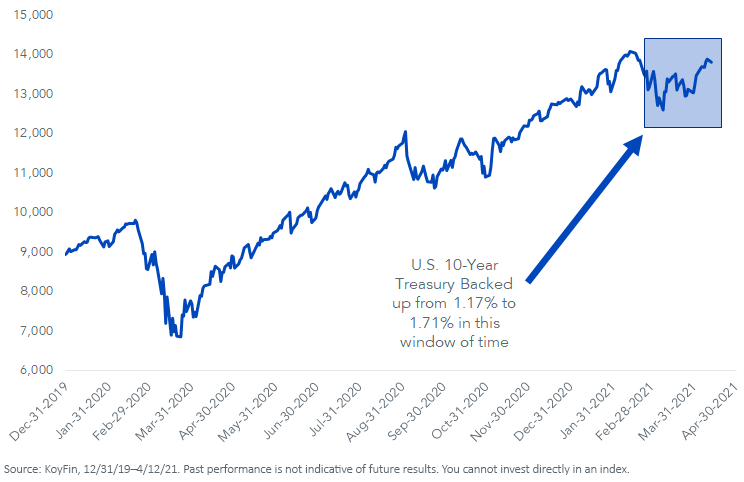
The NASDAQ gave us a hint about what it thinks of the bond market’s sell-off when it tumbled from 14,095 to 12,609 over 16 sessions in February and March.
The primary catalyst was a backup in the 10-Year Treasury yield by a half percentage point or so. The yield has stabilized a bit since then and the NASDAQ has found footing in recent weeks, but what if the 10-Year note decides to take another run at 2%?
There is a clear focus in this market. If I could write it in an equation, it would be:
Rising Rates = Growth Stocks “Off” + Value Stocks “On”
It has to do with interest rate sensitivity. The NASDAQ is loaded with a ton of companies that promise distant profits. It is currently accorded a trailing P/E of 73 and a forward P/E of 34.6, and the sudden spike in rates catalyzed the net present value math on its components to morph a pot of gold into tin.
Figure 1: NASDAQ Composite
Amid the NASDAQ’s stumble, it would have been reasonable for the S&P 500 Value Index to have sold off in sympathy. Yet that did not happen. Value stocks were so down and out over the last generation that rising rates are breathing new life into them—the index is clawing its way to new highs above 1,400, having closed 2020 at 1,267.
The concern for the NASDAQ and other growth-oriented indexes is that many seers believe the fixed income sell-off must certainly be overdone, and that a settling into current yields must be imminent. Once the market digests these new interest rates, goes the refrain, the NASDAQ can get on with its raging bull market once more.
That assumes that these new “high” yields are viewed as a juicy opportunity. Before you stew on that, a quick reminder: the Street consensus is for a federal budget deficit of 14.3% of GDP this year, some of the deepest red ink in the world.
But it will be all over once Covid-19 goes away, back to balanced budgets, right? Not even close.
J.P. Morgan’s deficit-to-GDP ratio estimate is for -10.1% next year. That would mark three consecutive years in the double digits, with all three exceeding of those years exceeding any level observed since WWII. Will it stop in 2023? Your guess is as good as mine, but I doubt it.
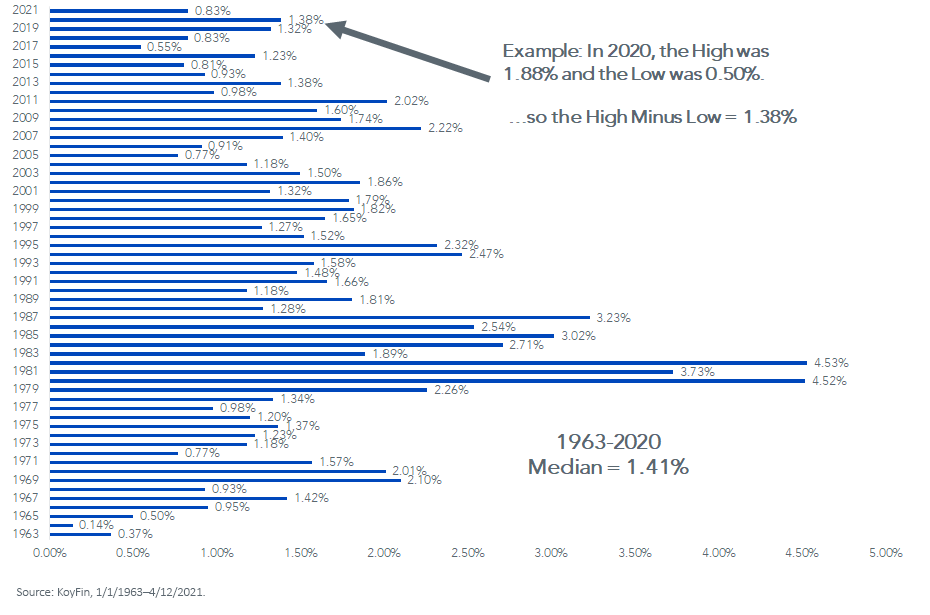
Let’s note that the highest yield observed on the benchmark Treasury in 2021 is 83 basis points (bps) higher than the year’s lowest observed yield, which came on the first business day in January. The action we have seen in this year’s first four months occurs as a matter of course.
Figure 2: 10-Year U.S. Treasury: Difference between Yearly High & Low Yield
Maybe my concerns are unfounded. Perhaps rates will slink into the sofa cushions once again, as they have for three decades in Japan. That’s one potential hypothesis posited by many in this business. But I am not keen on hanging around in the NASDAQ while the market makes up its mind.
Go back to the equation, at least as it applied to the February and March action:
Rising Rates = Growth Stocks “Off” + Value Stocks “On”
Does the equation always work? Hardly. But has it been the play in 2021? Definitely.
I have been using this value-core-growth spectrum to describe the profile of our U.S. equity mandates. If you are thinking pain will come from fixed income, then the aspirin may be value stocks.
Figure 3: The Value-Core-Growth Spectrum, by Forward P/E
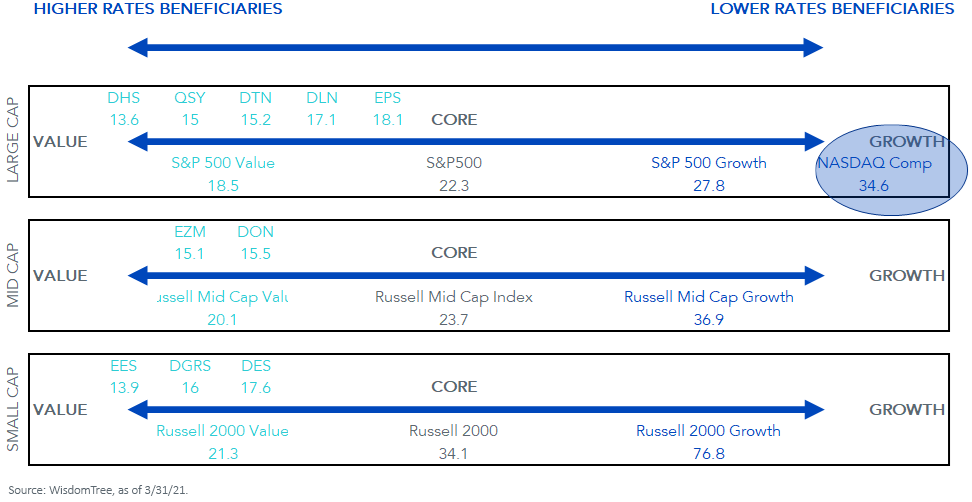
For standardized performance of the Funds in the chart, please click here.
Important Risks Related to this Article
There are risks associated with investing, including the possible loss of principal. Foreign investing involves special risks, such as risk of loss from currency fluctuation or political or economic uncertainty. Funds focusing their investments on certain sectors and/or smaller companies increase their vulnerability to any single economic or regulatory development. This may result in greater share price volatility. There are risks of investing in value stocks such as the potential that a particular stock may not rise to its anticipated intrinsic value and could decline further in value. Please read each Fund’s prospectus for specific details regarding the Fund’s risk profile.
Share & Comment
Popular Posts
Categories
Related Links