
Value Stocks Appear Poised to Capitalize on Closing Economic Slack


If low inflation after the 2009 global financial crisis meant growth stock dominance all these years, does an inflation surprise lead to new leadership by value stocks?
Price pressure in everyday goods and services has been trending lower since I breathed my first breath four decades ago. As our collective memories age and fade, I suspect many find it hard to imagine that U.S. consumer price inflation (CPI) was running at 10%–14% annually from 1979–1981.
Figure 1: Annual U.S. Consumer Price Inflation (CPI)
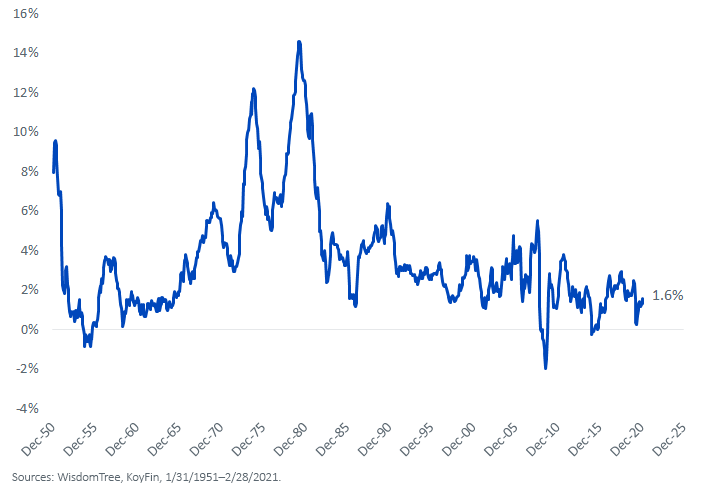
Annual M2 money supply growth averaged 6.4% in the 40 years to January, including the big surge over the last year, which witnessed it rise 25.8%. With such increases in the number of dollars in our pockets, why then is it a matter of routine to witness inflation in the 1%–2% range?
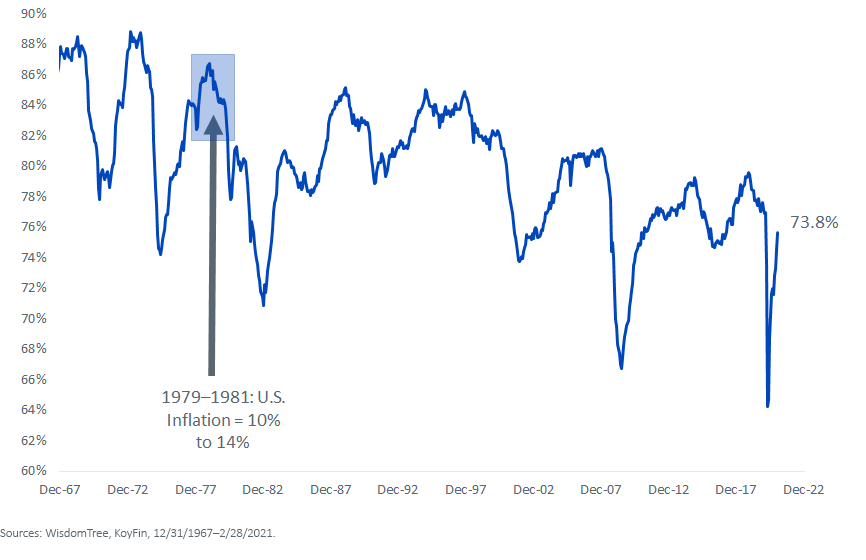
Capacity utilization partly explains it. The United States’ industrial machine is only running at 73.8% of its full-throttle capability (figure 2). The downtrend over the decades is clear and present.
Figure 2: U.S. Capacity Utilization
However, a few things are going on. First, last year’s 26% growth in money supply may still be filtering its way into the system, aching to show up in the prices at the supermarket. And if the U.S. does hit COVID-19 herd immunity in the coming months, a surge in demand for goods and services could bring capacity utilization in line with levels consistent with a humming rebound.
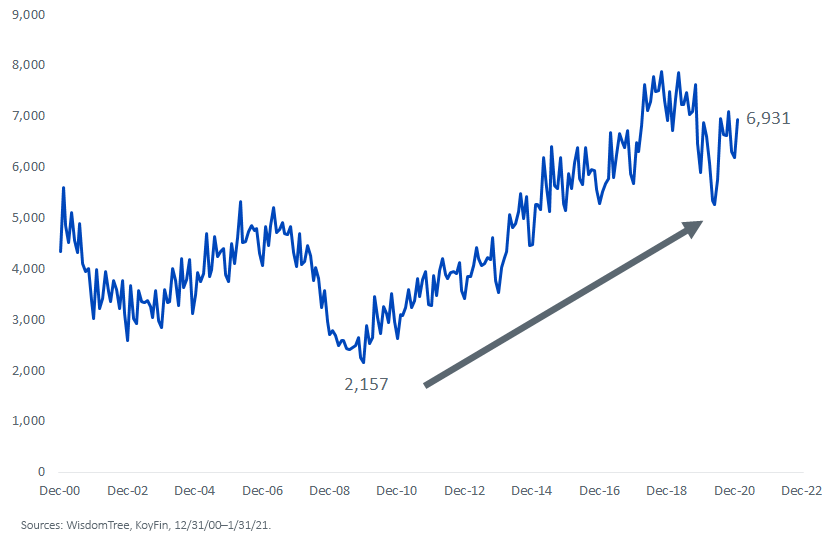
Unlike the last recovery, where job seekers in 2010 and 2011 could choose from just two or three million jobs, right now there are nearly seven million job postings (figure 3). Not only that, but “laptop workers” may have an easier go at finding the perfect match now that many can work from anywhere. Employers need those jobs to be filled; wage inflation is the likely recipe.
Figure 3: U.S. Total Nonfarm Job Openings (Thou.)
The themes of the stock market’s rally from the global financial crisis low on March 9, 2009 to its pre-crash highs on February 19, 2020: disinflation and growth scarcity.
Over those nearly 11 years, the S&P 500 Growth Index outperformed S&P 500 Value by 248 basis points (bps) annually (19.42% vs. 16.94%, respectively). In the crash itself, the S&P 500 Growth outperformed yet again, declining “only” 31.33% from February 19, 2020 to March 23, 2020, while the S&P 500 Value Index fell 36.78%.
When the market turned on a dime last March, certainly that would be the time for value to shine, right?
Wrong.
Even though stocks were on rocket boosters, the bond market was still pricing in disinflation: The 10-Year U.S. Treasury note yield kept drifting lower. Though it yielded 0.79% in March when the stock market bottomed, by August 4, 2020, it was down to 0.51%.
The bond market’s disinflation/deflation forecast showed up in the returns of growth and value. The S&P 500 Growth Index won the early stages of the COVID-19 recovery rally, rising 56.6% through August 4, 2020. Value struggled to keep up, running 38.4% higher.
So that we have this straight: Growth outperformed during an 11-year rally, then outperformed again in a crash, then outperformed again in the recovery. A miserable situation for value investors.
But the story does not end on August 4, 2020. Since then, the t-note yield has turned tail, with the bond market selling pushing its yield to 1.72%.
The cause: an inflation buzz. From the bond market’s August extreme through March 30, 2021, the S&P 500 Value Index has rallied 27.8%, trudging ahead of the 15.1% return of the S&P 500 Growth Index.
The bond market is guiding the stock market. If falling rates meant growth stock dominance, it would seem the opposite would mean…well, the opposite. A nascent value cycle may be under way.
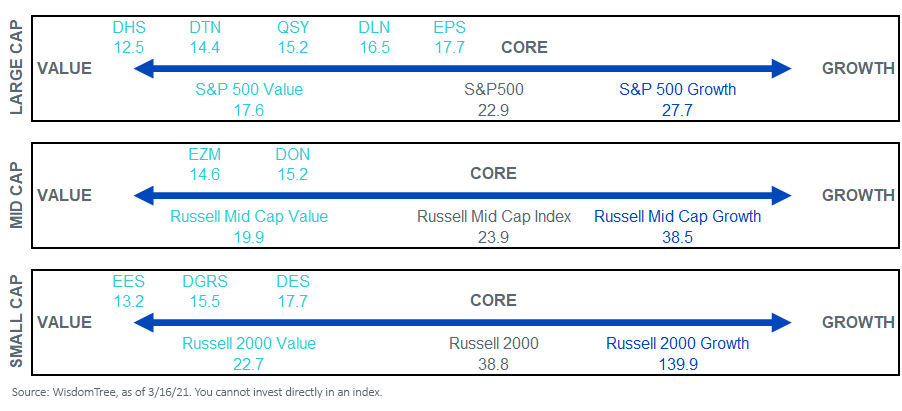
Here is a value-core-spectrum for choosing how to play U.S. equities via WisdomTree.
Figure 4: WisdomTree’s Value-Oriented U.S. ETFs, by Forward Price-to-Earnings (P/E) Ratio
For definitions of indexes in the chart, please visit our glossary.
For standardized performance of the Funds in the chart, please click here.
Important Risks Related to this Article
There are risks associated with investing, including the possible loss of principal. Funds focusing their investments on certain sectors increase their vulnerability to any single economic or regulatory development. This may result in greater share price volatility. Please read each Fund’s prospectus for specific details regarding the Fund’s risk profile.
Share & Comment
Popular Posts
Categories
Related Links