
Dividend Growth: Why It Matters


All of the sudden, the safety and sustainability of dividend payments has become an important topic.
The forced shutdown of the U.S. economy caused a furious pace of dividend cuts from the most impacted businesses aiming to preserve cash.
In recent weeks, Jeremy Schwartz, WisdomTree’s Global Head of Research, has provided historical context on dividends, including spreads between dividends yields and government bond yields and the historical stability of dividends relative to market prices. This post focuses on current market trends we’re watching closely.
Why Dividends Matter: Prices Track Dividend Growth
About 19% of the market cap of the S&P 500 currently comes from non-dividend-paying companies. Some of the largest companies in the S&P 500—Alphabet, Amazon, Facebook, Netflix—pay no dividends at all.
The exceptional returns of these companies over the past decade bred a narrative that dividends are no longer as important as they used to be.
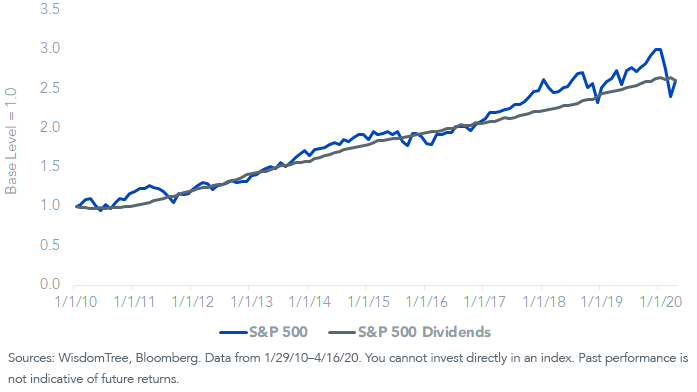
But this is a myth. Since January 2010, the S&P 500 has returned 9.8% on a price basis. The dividend growth on that index? 9.8%.1
We continue to highlight this critical relationship that connects long-term stock market gains with the underlying cash flow that goes to shareholders in the form of dividends.
S&P 500 Price Return and Dividend Growth
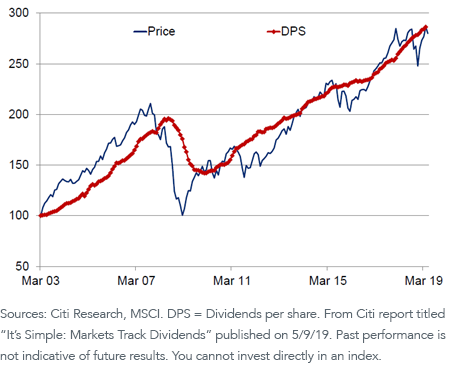
This relationship holds for global equities as well. A Citi Research note titled, “It’s Simple: Markets Track Dividends,” included a similar chart for the MSCI ACWI Index back to 2003. Its conclusion:
The two [dividends and share prices] have tracked each-other over time. Sure, sometimes share prices run ahead of dividends and sometimes they lag. But these de-couplings don’t last too long. The overall historical message is clear: get dividends right and you will get share prices right.
MSCI ACWI Index: Price Return and Dividend Growth
Dividend Forecasts: Mixed Projections
We are not implying the “get dividends right” part is easy or straightforward. A decline in S&P 500 dividends is all but certain for 2020. But there is significant dispersion from Wall Street forecasts regarding the steepness of the drop and the path of recovery.
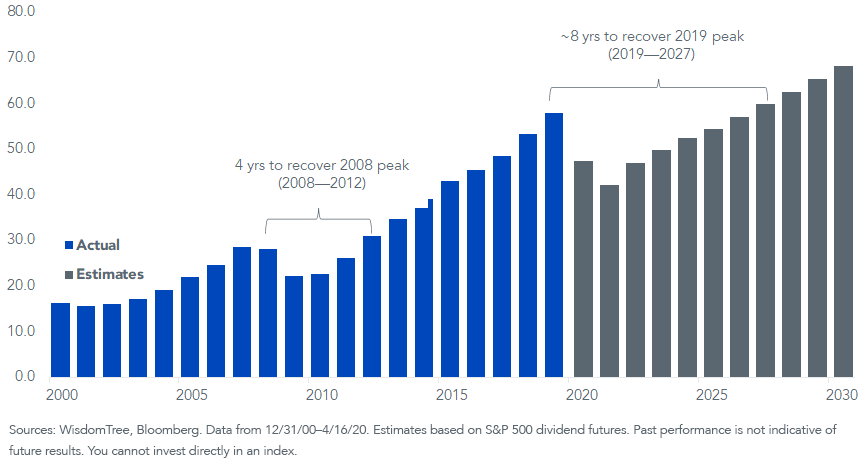
We can use S&P 500 dividend futures as a baseline to estimates. This gives a view of what traders and investors see for the path of dividends over the next decade.
Futures currently indicate an 18% decline in 2020, with further declines in 2021. For comparison, 2009 was the worst calendar year drop for S&P 500 dividends in history, when dividends declined 20%.
In late March, dividend futures were indicating a 33% decline in 2020, showing how much of the overall market bounce also coincided with dividend estimates bouncing higher.
S&P 500 Dividends ($ Per share)
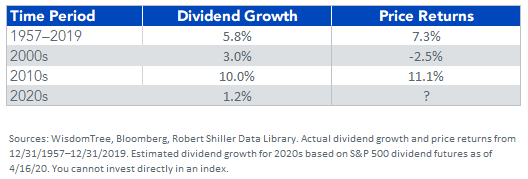
Based on dividend futures, dividend growth for the decade from 2020–2029 would be estimated at a low 1.2% annualized rate. Using the close relationship of dividend growth and price returns, this would imply lackluster returns to come for large-cap U.S. stocks.
S&P 500 Index: Annualized Rates
In an April 7th note, Bank of America argued that dividend cuts indicated from futures were overly pessimistic—its modelling suggested just a 7% drop from the large-cap index. Its reasoning was mainly that the two highest dividend-paying sectors—tech and financials—don’t look vulnerable to cuts.
On the other hand, a March 30th note from Goldman Sachs forecasted a 25% drop—not all too different from futures at the time. However, it thought the seven- to eight-year recovery time that futures implied was too gloomy. It forecasts dividends will fully recover within four years, as they did after the financial crisis.
Challenges to Modelling: Social and Political Consequences
Part of what is making forecasting cuts so challenging are unique political and social ramifications.
On the politics front, consider the provision in the CARES Act, which budgeted low-interest loans for businesses:
…until the date 12 months after the date the loan or loan guarantee is no longer outstanding, the eligible business shall not pay dividends or make other capital distributions with respect to the common stock of the eligible business.
There’s also negative headline risk potential for companies that furlough their employees but continue to pay a dividend—this consequence hits Consumer Discretionary companies disproportionately.
Conclusion: Cuts Contained…So Far
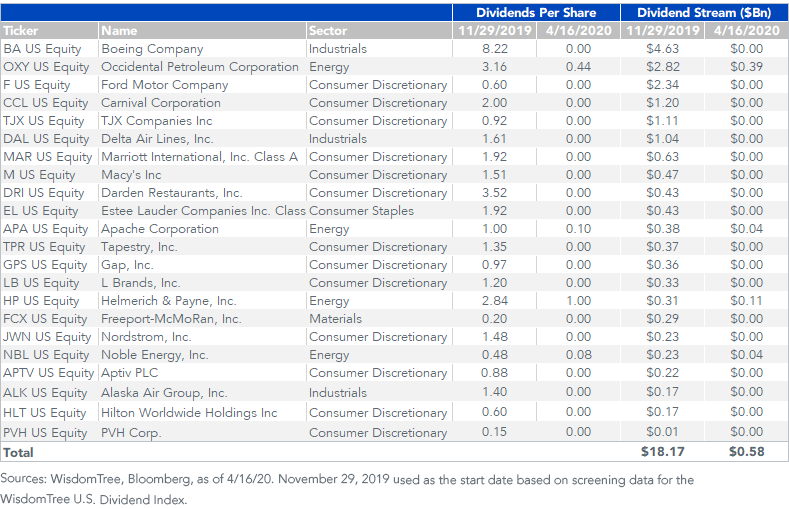
There have been 18 dividend suspensions and four dividend reductions from S&P 500 constituents so far this year. In sum, these amount to an $18bn cut to the total Dividend Stream® (dividends per share x shares outstanding) of the index.
For context, WisdomTree’s U.S. LargeCap Dividend Index had a total Dividend Stream of $470bn entering the year. So that $18bn would equate to less than 5%.
Of those 22 companies, 13 are Consumer Discretionary names. The restrictions on going to malls and restaurants and disincentives on travel are significantly weighing on that sector.
S&P 500 Index Dividend Cuts
The two biggest dividend-paying sectors—Financials and Information Technology—have so far been largely spared of cuts and have even seen dividend growth so far this year. The biggest U.S. banks have pledged to continue paying dividends; many of the largest tech companies have sizeable cash balances to cover dividends.
What’s Next?
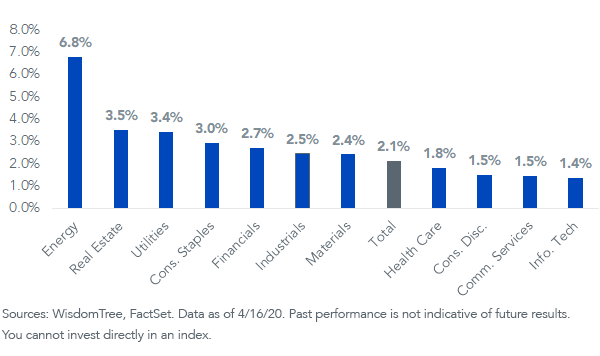
Based on the cuts thus far and cuts estimated from sector yields—yields tend to spike before anticipated dividend cuts—it seems likely that large-cap dividend cuts will be most concentrated by Energy and Consumer Discretionary companies.
The combined dividend market cap weights (contributions to the Dividend Stream) of these two sectors is about 15%. This compares to the 30% that came from the Financials sector alone in 2008 when dividends were wiped out.
Given the relatively small contribution to the total Dividend Stream of the two most impacted sectors, in our opinion, a 2008–2009 scenario for dividend cuts seems unlikely for large caps, for now.
S&P 500 Dividend Yields
In future posts we will offer a more detailed look at dividend cuts and valuations by sector, market cap (large, mid and small), and style (dividend growth versus high yield) for WisdomTree’s eight U.S. dividend indexes.
11/31/2010-4/16/2020.
Share & Comment
Popular Posts
Categories
Related Links