
Dividend Yields vs. Bond Yields: An Easy Pick


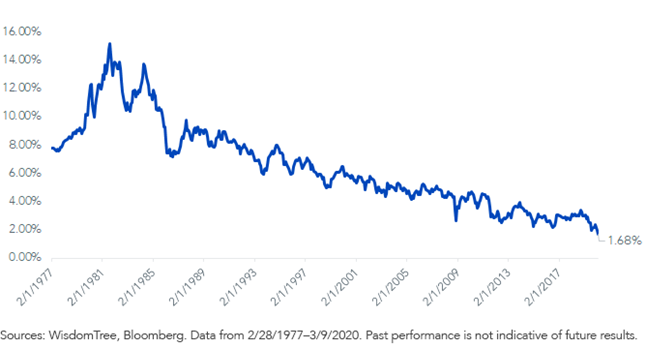
Interest rates are hitting fresh, all-time lows due to coronavirus fears hitting an economy that had previously been quite strong.
The 30-Year U.S. Treasury bond yield briefly crashed below 1% and now stands at 1.30% as of March 11th, while the 10-Year U.S. Treasury note yield went below .6% before pushing back above .8%.
30-Year U.S. Treasury Bond Yield
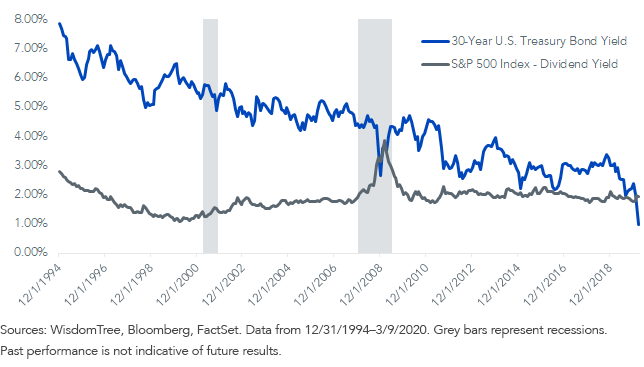
During the 2008 global financial crisis, the S&P 500’s dividend yield briefly went above the 30-Year U.S. Treasury bond yield, but it did not stay there long.
Investors forecasted severe dividend cuts, which pushed dividend yields up just as Treasury rates were plummeting.
Both yields normalized as realized dividend cuts brought down dividend yields and improving economic conditions pushed Treasury rates up.
Treasury Yields vs. Dividend Yield
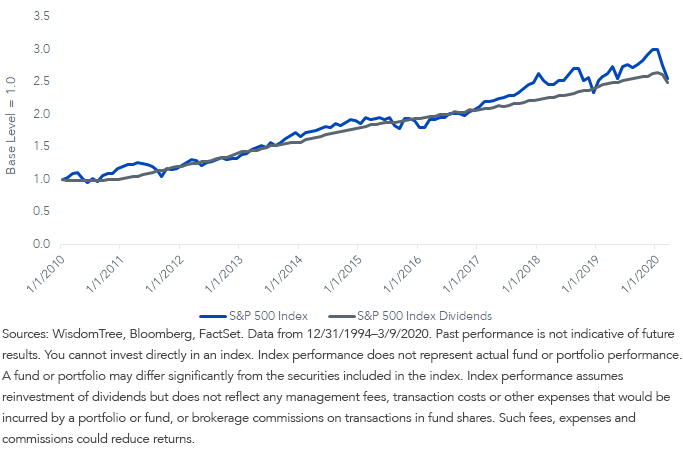
One interesting fact about the market’s gains over the last decade is that equity appreciation coincided one-for-one with dividend growth on the market. So, the market has not actually become more expensive on a price-to-dividend or a dividend-yield basis.
S&P 500 - Price Return and Dividend Growth
After recent interest rate declines, the S&P 500’s dividend yield is now almost four times the 10-Year U.S. note yield, and almost 100 basis points (bps) higher than the 30-Year Treasury bond yield.
Dividend Weighting Goes Further
WisdomTree is increasingly convinced interest rates are going to stay low for much longer than we previously anticipated. This will create challenges for traditional investors.
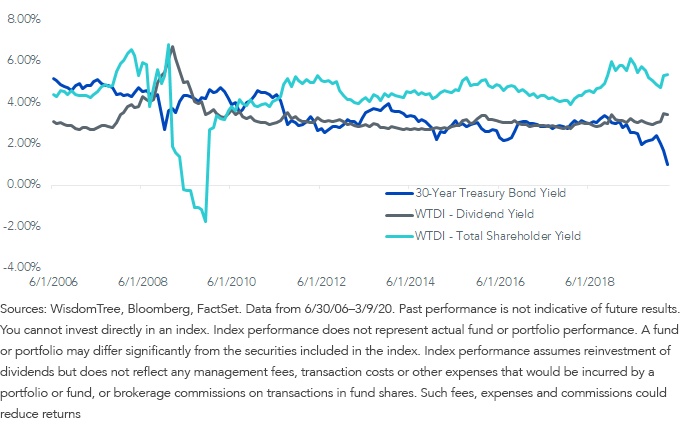
Dividend-weighted strategies like those WisdomTree launched in 2006 can help increase the dividend advantage over Treasury bonds even further. The dividend yield on our broadest index of dividend payers began March at 3.45%—more than double the interest income on the 30-Year bond.
The total shareholder yield (dividend yield plus net buyback yield) for the broad dividend index is 5.36%, a 437 basis point (bps) advantage over the 0.99% low for the 30-Year U.S. Treasury bond.
This spread has only been greater over the 14-year history of the index once, during the previous all-time low for the 30-Year U.S. Treasury bond in August 2019.
Bond Yield vs. WisdomTree U.S. Dividend Index (WTDI) Yield
Markets Moving More Than Fundamentals
Professor Jeremy Siegel reckons that over 90% of the value of a stock comes from its profits more than 12 months out. So, if we wiped out all profits over the next 12 months, the impact should be less than 10%. If earnings are down 30%–40% this year and then return to normal in 2021, we would not get market declines like we have witnessed thus far.
The maximum dividend decline in S&P 500 stocks over the last 60 years came in 2009, during the financial crisis, when dividends from the financial sector evaporated and caused overall dividends to fall 25%. It took four years for dividends to pass their highs after falling during the crisis.
For fundamentally driven investors, the dividend yields on broad U.S. markets look attractive compared to the alternatives in the bond market.
There are two potential solutions from the WisdomTree family:
WisdomTree U.S. Total Dividend Fund (DTD): This ETF seeks to track the price and yield performance, before fees and expenses, of the WisdomTree U.S. Dividend Index, which is one of the most inclusive indexes of all dividend payers in the U.S. The dividend-weighting mechanism emphasizes total size of dividend distributions. Our asset allocation model portfolios that we launched in collaboration with Professor Siegel include DTD, which is the ETF that we utilize for exposure to the broad market of dividends in the U.S.
WisdomTree U.S. LargeCap Dividend Fund (DLN): This ETF seeks to track the price and yield performance, before fees and expenses, of the WisdomTree U.S. LargeCap Dividend Index. This Index includes the 300 largest stocks by market capitalization from the WisdomTree U.S. Dividend Index. This ETF represents the large-cap segment of DTD if an investors does not want total market exposure.Important Risks Related to this Article
There are risks associated with investing, including possible loss of principal. Funds focusing their investments on certain sectors increase their vulnerability to any single economic or regulatory development. This may result in greater share price volatility. Please read each Fund’s prospectus for specific details regarding the Fund’s risk profile.Share & Comment
Popular Posts
Categories
Related Links
Jeremy Schwartz has served as our Global Chief Investment Officer since November 2021 and leads WisdomTree’s investment strategy team in the construction of WisdomTree’s equity Indexes, quantitative active strategies and multi-asset Model Portfolios. Jeremy joined WisdomTree in May 2005 as a Senior Analyst, adding Deputy Director of Research to his responsibilities in February 2007. He served as Director of Research from October 2008 to October 2018 and as Global Head of Research from November 2018 to November 2021. Before joining WisdomTree, he was a head research assistant for Professor Jeremy Siegel and, in 2022, became his co-author on the sixth edition of the book Stocks for the Long Run. Jeremy is also co-author of the Financial Analysts Journal paper “What Happened to the Original Stocks in the S&P 500?” He received his B.S. in economics from The Wharton School of the University of Pennsylvania and hosts the Wharton Business Radio program Behind the Markets on SiriusXM 132. Jeremy is a member of the CFA Society of Philadelphia.