DGRW
U.S. Quality Dividend Growth Fund

Published April 24, 2024

Global Head of Research
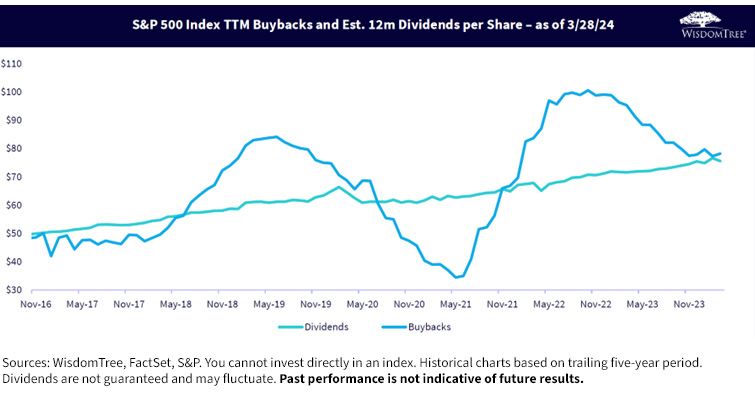
In 2024, we have seen Meta Platforms, Salesforce.com and Booking Holdings (parent company of Priceline.com) initiating dividend payments.1 Many technology companies have accumulated significant amounts of cash, with more calls to return this cash to shareholders by initiating dividends.
Of course, dividends are not the sole way cash can be returned to shareholders. In the U.S. equity landscape, buybacks can often be even larger.
This chart on dividends versus buybacks shows the stability versus cyclicality and volatility of buyback streams—the two are hardly comparable if one wants a predictable stream of cash flows from stocks.
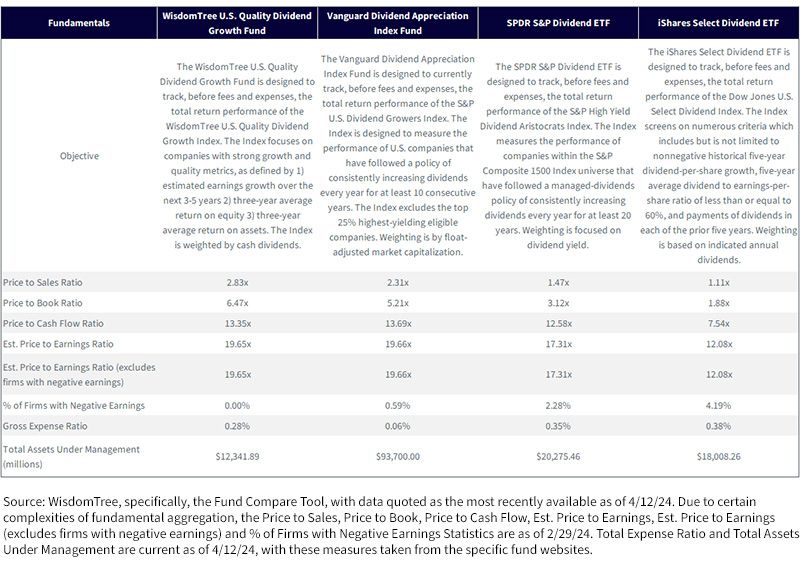
One of the biggest categories—reflecting all the demand for this concept—is for dividend-growth ETFs. Investors love the idea of a company raising its dividend over time, and they love the idea of a stream of income that has the potential to grow over timeover time. Here are five of the largest such ETFs in the ecosystem:
To summarize one critical point involving historical dividend-growth requirements for each of the indexes tracked by these ETFs:
The reason we underline that point is simple: on February 1, 2024, Meta Platforms initiated a regular cash dividend.7
WisdomTree initiated a special rebalance to add this immediately substantial dividend payer to its appropriate Indexes, including the one tracked by DGRW, whereas these other approaches will have to wait varying numbers of years before Meta Platforms becomes eligible.
Of course, these dividend-growth requirements in a vacuum don’t mean much—we believe that what investors really care about are returns. If waiting 20 years to include companies that grow their dividends has been a route to strong performance—that’s great. If not, it’s a very stringent criterion that investors aren’t being compensated for.
Many view the 10-year period as the most valid proof point in terms of returns. Being around for 10 years in the competitive investment management industry is impressive, and there is an implicit assumption that one should experience a few ups and downs in equity markets during a 10-year period. In figure 2a:
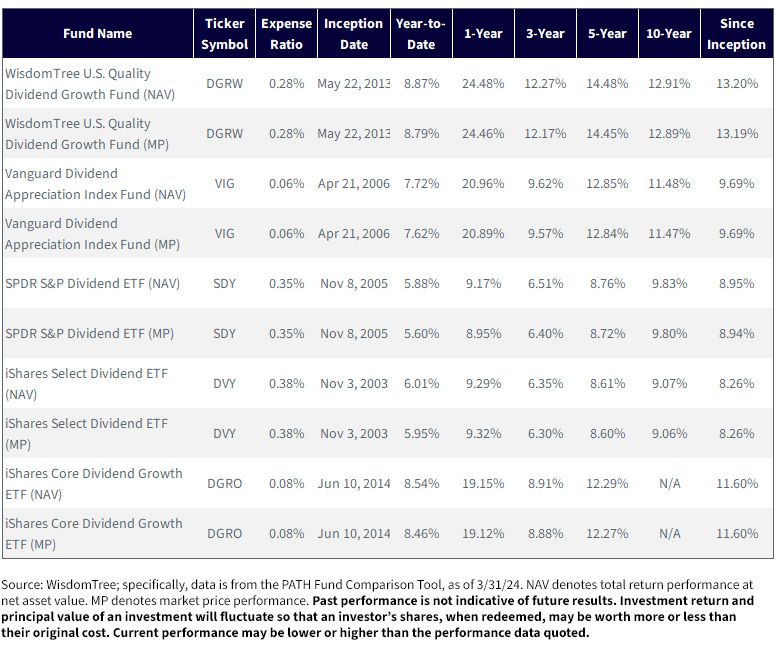
For the most recent month-end and standardized performance and to download the respective Fund prospectuses, click the relevant ticker: DGRW, VIG, SDY, DVY and DGRO.
If we remove the need to look only at standardized returns (as of the end of a given quarter) and look as of April 12, 2024:
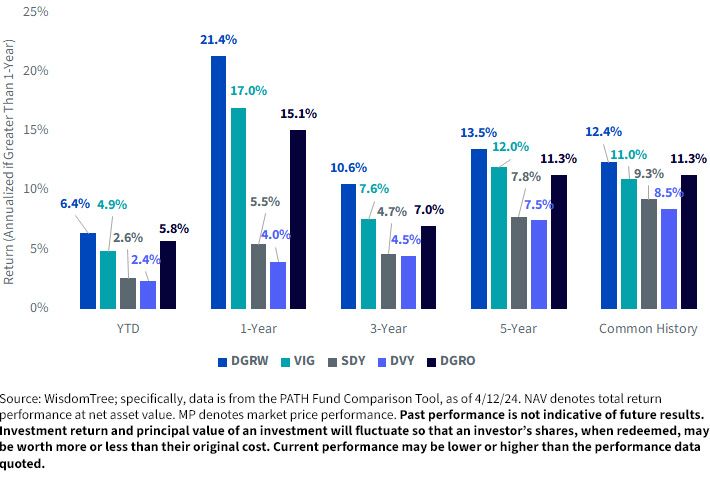
For the most recent month-end and standardized performance and to download the respective Fund prospectuses, click the relevant ticker: DGRW, VIG, SDY, DVY and DGRO.
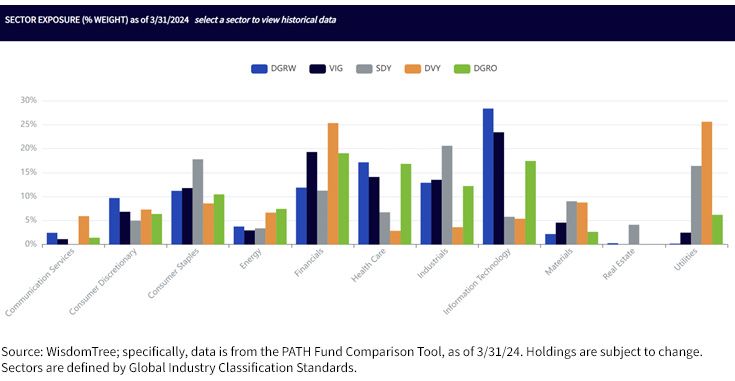
Different sectors have different relationships to dividend payments. Typically, one of the starkest comparisons involves looking at Utilities versus Information Technology:
When we look at figure 3:
We think that contrast ultimately says a lot in terms of how different strategies are generating different performances.
For definitions of terms in the table above, please visit the glossary.
If you are interested in diving more into the comparison of these Funds, please check out our Fund Comparison Tool.
1 Source: Paul R. La Monica, “In a Wobbly Market, Look for Dividend Growth,” Barron’s, 4/11/24.
2 Source: WisdomTree U.S. Quality Dividend Growth Index, WisdomTree, https://www.wisdomtree.com/investments/index/wtdgi
3 Source: S&P Dividend Growers Index Series Methodology, S&P Dow Jones Indexes, updated as of April 2024.
4 Source: S&P Dividend Aristocrats Indexes Methodology, S&P Dow Jones Indexes, updated as of January 2024.
5 Source: Dow Jones U.S. Select Dividend Index. S&P Dow Jones Indexes.
6 Source: Construction Rules for the Morningstar Dividend Growth Indexes, updated as of November 2023.
7 Source: Press release: “Meta Reports Fourth Quarter and Full Year 2023 Results; Initiates Quarterly Dividend,” 2/1/24.
8 Source: Press release: “Apple Announces Plans to Initiate Dividend and Share Repurchase Program,” 3/19/12.
There are risks associated with investing, including the possible loss of principal. Funds focusing their investments on certain sectors increase their vulnerability to any single economic or regulatory development. This may result in greater share price volatility. Dividends are not guaranteed, and a company currently paying dividends may cease paying dividends at any time. Please read the Fund’s prospectus for specific details regarding the Fund’s risk profile.
All funds are managed differently and do not react the same to economic or market events. The investment objectives, strategies, policies or restrictions of other funds may differ and more information can be found in their respective prospectuses. Therefore, we generally do not believe it is possible to make direct fund to fund comparisons in an effort to highlight the benefits of a fund versus another similarly managed fund.
U.S. Quality Dividend Growth Fund

Global Head of Research
Christopher Gannatti began at WisdomTree as a Research Analyst in December 2010, working directly with Jeremy Schwartz, CFA®, Director of Research. In January of 2014, he was promoted to Associate Director of Research where he was responsible to lead different groups of analysts and strategists within the broader Research team at WisdomTree. In February of 2018, Christopher was promoted to Head of Research, Europe, where he was based out of WisdomTree’s London office and was responsible for the full WisdomTree research effort within the European market, as well as supporting the UCITs platform globally. In November 2021, Christopher was promoted to Global Head of Research, now responsible for numerous communications on investment strategy globally, particularly in the thematic equity space. Christopher came to WisdomTree from Lord Abbett, where he worked for four and a half years as a Regional Consultant. He received his MBA in Quantitative Finance, Accounting, and Economics from NYU’s Stern School of Business in 2010, and he received his bachelor’s degree from Colgate University in Economics in 2006. Christopher is a holder of the Chartered Financial Analyst Designation.
