

Looking Back at Equity Factors in Q1 2024 with WisdomTree
Published April 18, 2024

Pierre Debru
Head of Research, WisdomTree Europe.
This year started on a strong note, with global equity markets gaining 8.9%.1 The initial focus was on artificial intelligence, its growth potential and its impact on corporate profitability. However, with better-than-expected economic data being published in the U.S., but also in Europe and China, market confidence grew, leading to a regional broadening of the bull market. Europe closed 7.6%1 up, quite close to the 10.3%1 of the U.S. The only weakness remains in Asia, leading to emerging markets returning only 2.4%.1
This instalment of the WisdomTree Quarterly Equity Factor Review aims to shed some light on how equity factors behaved during this first quarter and how this may have impacted investors’ portfolios.
- Overall, quality and growth continued to do well in developed markets. However, momentum took the lead, returning double-digit outperformance in the U.S. and globally.
- Small-cap equities suffered from the postponement of rate cuts. After a strong Q4, they posted the deepest underperformance in Q1.
- High dividend, value and min volatility continued to suffer.
- In emerging markets, momentum was also strong, but growth led the way, with Information Technology stocks and new economy companies benefiting the most from the better-than-expected economic news.
Performance in Focus: Continued Bull Run for Q1
In Q1, the MSCI World (+8.9%) and the MSCI USA (+10.3%) indexes continued to perform very strongly. The impact of the AI megatrend continued to be felt, with Nvidia gaining 82.5% during the quarter, for example. But the main news was on the economic front. The U.S. economy remained robust, leading to the postponement of rate cuts to later in the year. Economic data from Europe and China, while not amazing, was better than expected, leading to good performance in those markets as well.
Overall, this led to some broadening in terms of the source of market performance. Only four out of the Magnificent 7 beat the S&P 500 this quarter, for example. Only Nvidia and Meta posted significant outperformance. The impact on factors was also clear as it was a difficult quarter in which many factors underperformed, as well as some rotation.
- In global developed markets, growth and quality continued to outperform, with the exception of Europe, where quality did not do as well.
- Momentum was the strongest factor this quarter. It outperformed in all regions, posting double-digit outperformance in the U.S. and globally.
- The fortune of small-cap equities changed radically from being the best factor in Q4 to being the worst one in Q1.
- In developed markets overall, high dividend, min volatility and value suffered the bulk of the underperformance.
- In emerging markets, momentum was also strong, but growth led the way, with Tech stocks and new economy companies benefiting the most from the better-than-expected economic news.
Figure 1: Equity Factor Outperformance in Q1 2024 across Regions
Market Breadth Is Improving: A Positive Sign for the Current Bull Market
In Q1, U.S. equities returned their second consecutive double-digit returns. While this may seem like nothing in the context of the last 18-month rally, it is, in fact, quite rare. This is only the nineteenth time since 1927 that this happened (i.e., 5% of the time). Interestingly enough, the performance in the following six months has been positive 16 times out of 18, and the performance in the following 12 months has been positive 15 times out of 18.
Figure 2: S&P 500 Performance Following Two Consecutive Quarters of Double-Digit Returns
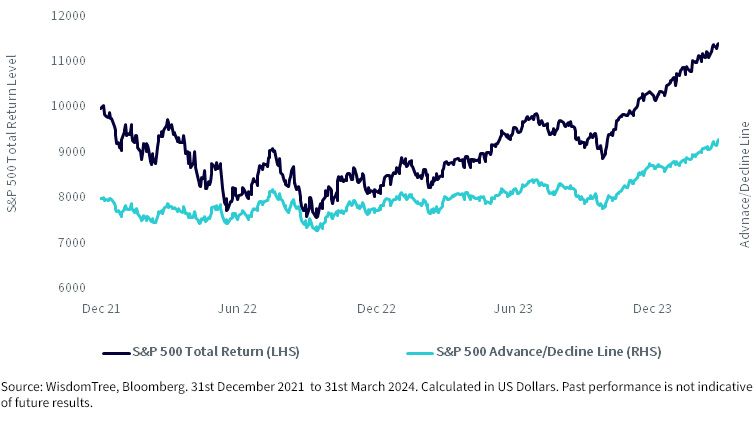
Investors have focused on the market’s narrowness since early 2023 and the emergence of the Magnificent 7 narrative. As discussed earlier, Q1 showed a divergence in the performance of those seven mega caps, with Tesla and Apple showing some weakness. To assess the evolution of the market’s breadth this quarter, in figure 3, we look at the advance/decline line for the S&P 500.
The advance/decline line is a cumulative indicator, calculated by adding the difference between the number of advancing and declining stocks on a daily basis. The indicator goes up if more stocks advance rather than decline. It helps investors assess how wide the market is. In a rising market, if the indicator is going up, it means that the market is wide and that a majority of stocks are going up with the market. If the indicator is down, though, it shows that only a minority of stocks are driving the market up, indicating narrowness and a potential weakness of the rally.
Figure 3: S&P 500 Advance/Decline Line
It is clear from figure 3 that the market breadth has been improving since late 2023 and that the current bull market is now quite well supported.
Valuations Decreased in the U.S. in Q1
In Q1 2024, developed markets became mostly more expensive. However, small caps and growth stocks became cheaper. The drivers for those moves varied, though. The valuations of small caps declined due to negative performance, while growth stocks’ valuations declined due to increasing earnings.
Valuations in the U.S. mostly declined except in value and high dividend. On the contrary, in Europe, valuations increased almost across the board.
Figure 4: Historical Evolution of Price-to-Earnings Ratios of Equity Factors
Looking Forward to Q2 2024
Economies have been showing a lot of robustness, and while “higher for longer” will continue a bit longer than expected, rate cuts are coming. These easier monetary conditions, combined with improving economies and the broadening markets, should continue to provide a tailwind to equity markets. However, with valuations at relatively high levels and the upcoming U.S. presidential election, risks remain ever so present. A balanced approach to equity investment that combines upside participation and downside protection could remain a safe choice for investors.
Pierre Debru is an employee of WisdomTree UK Limited, a European subsidiary of WisdomTree Asset Management Inc.’s parent company, WisdomTree, Inc.
1 Sources: WisdomTree, Bloomberg, 12/31/23–3/31/24. Historical performance is not an indication of future performance and any investments may go down in value.
Categories
Related articles

About the contributor

Pierre Debru
Head of Research, WisdomTree Europe.
Pierre Debru leads WisdomTree’s European research team and plays a pivotal role in the strategic direction of our European research efforts. His key areas of expertise extend across equity factors and quantitative strategies, portfolio construction and model portfolios, and thematic and crypto investments. Before joining the company in 2019, Pierre worked in Investment Research for DWS and the Xtrackers range for over five years. During this period, he focused on smart beta investments, model portfolio construction and thought leadership. Pierre has over 20 years of experience in investments and structured asset management. He graduated from Ecole Central Paris and obtained a Master of Science in Mathematics applied to Finance.