DGRW
U.S. Quality Dividend Growth Fund

Published April 3, 2024

Global Head of Research
The Nasdaq 100 Index, designed to represent the largest 100 nonfinancial companies listed on the Nasdaq exchange,1 has delivered incredibly strong performance since the global financial crisis of 2008–09. When investors think about U.S. Tech or U.S. growth they frequently think first about this widely followed benchmark.
The Invesco QQQ Trust Series 1 (QQQ) is an investment vehicle designed to track the returns of this index, and it had more than $257 billion in assets under management as of April 3, 2024.2
With such a large base of assets and a history of more than 20 years, we are reminded of how, in different sports leagues, the team exhibiting longstanding strength, possibly referred to as a “dynasty,” creates a target for all other competitors to measure against. At WisdomTree, we are seeking to measure the performance of our strategies against the most widely followed competing funds and benchmarks in order to truly assess whether they are bringing value to investors.
In 2024, even if the Nasdaq 100 Index is not a fund’s official benchmark, you can expect that investors are going to compare different investment options back to it, given its strong performance and the proliferation of such terms as the Magnificent 7.
Toward the end of the first quarter, we noticed something interesting:
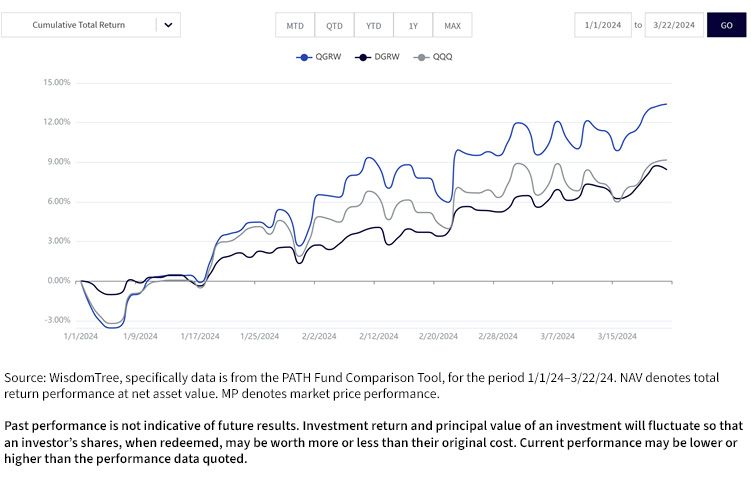
Figures 1a and 1b allow us to start seeing the numbers behind this story.
Figure 1a represents the standardized return comparison of QGRW, DGRW and QQQ, with data as of the most recent quarter-end, December 31, 2023. This is useful because we can look at the one-year figure, which is actually the calendar year 2023 figure. QGRW and QQQ were similar, in that the NAV return figures were in the range of 55%–56%, roughly speaking. DGRW, on the other hand, did not crack 20%.
Figure 1b represents the year-to-date 2024 NAV return of QGRW, DGRW and QQQ, specifically from January 1, 2024, to March 22, 2024, nearly the full first quarter. QGRW’s return is in the region of 13% over this period, whereas QQQ and DGRW are sitting around 9%, roughly speaking. This is still just a short period of time, but we wanted to explore “why” in order to start thinking through how this might or might not continue during the remainder of the year.
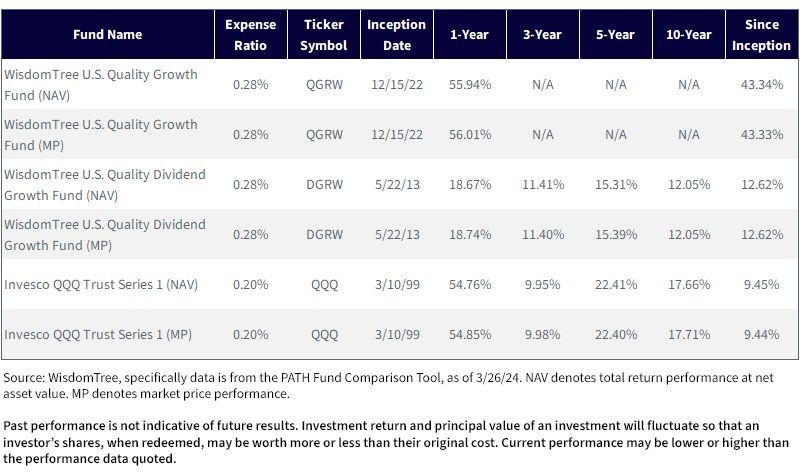
For the most recent month-end and standardized performance and to download the respective Fund prospectuses, click the relevant ticker: DGRW, QGRW and QQQ.
For the most recent month-end and standardized performance and to download the respective Fund prospectuses, click the relevant ticker: DGRW, QGRW and QQQ.
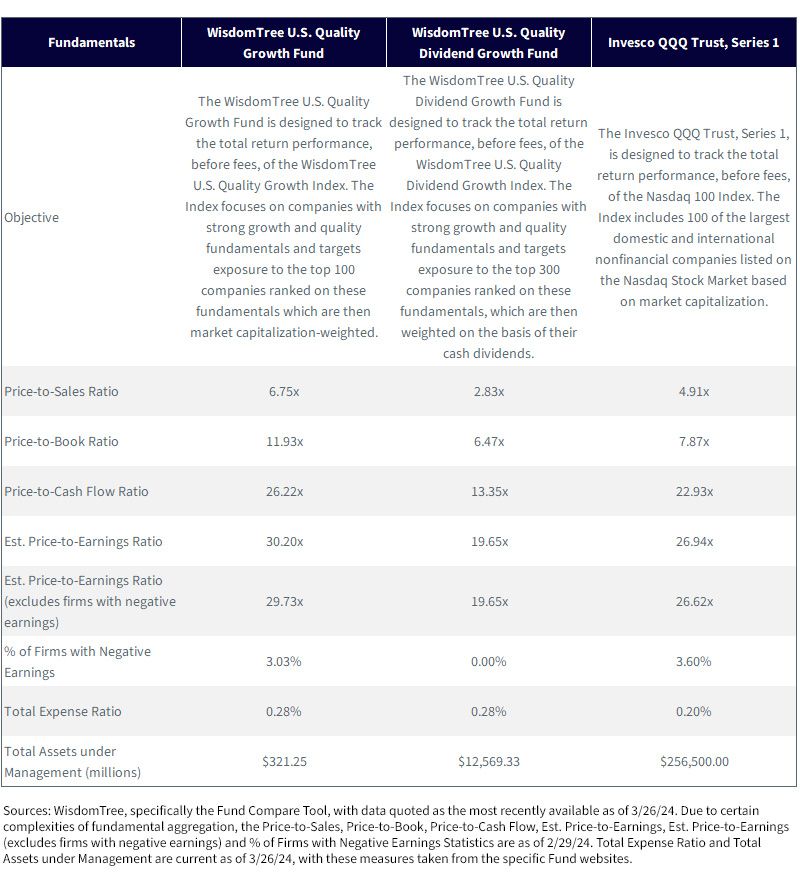
As we flipped the calendar from 2023 to 2024, many of us expected to see a greater dispersion in the performance of the largest companies. This has happened in the first part of 2024. Below, we detail the primary aspects of QGRW versus QQQ and DGRW versus QQQ.3
We know that there is a high degree of familiarity with QQQ among U.S. investors—not many ETFs have lasted more than 20 years and generated assets under management of more than $200 billion. However, when we note that this strategy is tracking the return of the Nasdaq 100 Index and think about what that index is designed to do, many that we have spoken to have been surprised.
The methodology really is just to include the 100 largest nonfinancial stocks listed on the Nasdaq exchange. A common assumption is that it is a tech index and it is true that the Magnificent 7 of 2023 were included within the top 10, but this is more coincidental than intentional.
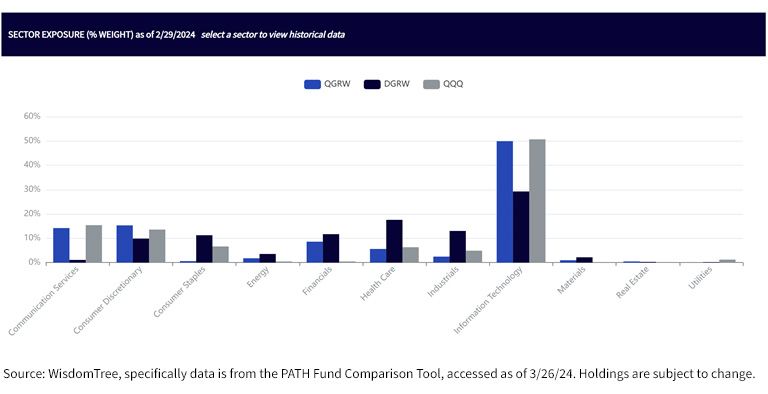
Figure 2 shows the sector exposures of QGRW, DGRW and QQQ.
In the end, it is clear that those looking for more similarity to the sector distribution in QQQ could be happier with QGRW, whereas DGRW is a notably different strategy almost across the board from a sector perspective.
It was clear that when 2024 began, most were expecting a different sort of equity market performance thank in 2023. As a reminder—2023 was the year of the Magnificent 7, where the largest companies led the way. The Nasdaq 100 Index, tracked by QQQ, captured this beautifully.
If 2024 is a year of greater dispersion and it’s not as simple as the largest companies delivering the strongest returns, then focusing on “better” companies—defined as having better fundamental metrics—could provide something useful and lead to at least possible performance differentiation. If equity market volatility were to tick up, the dividend orientation of DGRW could be particularly notable. In our opinion, even if we do not know the future with certainty, we can emphasize the importance of having evolving market outlooks match up with investment strategies that capture those ideas.
If you are interested in diving more into the comparison of these Funds, please check out our Fund Comparison Tool.
1 Source: Nasdaq 100 Index, Nasdaq. https://indexes.nasdaq.com/docs/Methodology_NDX.pdf
2 Source: Invesco QQQ fund detail page. https://www.invesco.com/qqq-etf/en/about.html
3 Source for attribution details: Bloomberg, specifically the PORT function, with time period specified 12/29/23–3/22/24. Holdings are subject to change.
For current Fund holdings, please click the respective ticker: DGRW, QGRW. Holdings are subject to risk and change.
There are risks associated with investing, including the possible loss of principal. Please read the Fund’s prospectus for specific details regarding the Fund’s risk profile.
DGRW: Funds focusing their investments on certain sectors increase their vulnerability to any single economic or regulatory development. This may result in greater share price volatility. Dividends are not guaranteed, and a company currently paying dividends may cease paying dividends at any time.
QGRW: Growth stocks, as a group, may be out of favor with the market and underperform value stocks or the overall equity market. Growth stocks are generally more sensitive to market movements than other types of stocks. The Fund is non-diversified and, as a result, changes in the market value of a single security could cause greater fluctuations in the value of Fund shares than would occur in a diversified fund. The Fund invests in the securities included in, or representative of, its Index regardless of their investment merit. The Fund does not attempt to outperform its Index or take defensive positions in declining markets and the Index may not perform as intended.

Global Head of Research
Christopher Gannatti began at WisdomTree as a Research Analyst in December 2010, working directly with Jeremy Schwartz, CFA®, Director of Research. In January of 2014, he was promoted to Associate Director of Research where he was responsible to lead different groups of analysts and strategists within the broader Research team at WisdomTree. In February of 2018, Christopher was promoted to Head of Research, Europe, where he was based out of WisdomTree’s London office and was responsible for the full WisdomTree research effort within the European market, as well as supporting the UCITs platform globally. In November 2021, Christopher was promoted to Global Head of Research, now responsible for numerous communications on investment strategy globally, particularly in the thematic equity space. Christopher came to WisdomTree from Lord Abbett, where he worked for four and a half years as a Regional Consultant. He received his MBA in Quantitative Finance, Accounting, and Economics from NYU’s Stern School of Business in 2010, and he received his bachelor’s degree from Colgate University in Economics in 2006. Christopher is a holder of the Chartered Financial Analyst Designation.
