

The 2024 Small-Cap Playbook: Value and Dividends
Published December 27, 2023

Brian Manby, CFA
Equity Strategist
U.S. small caps struggled for the past two years as rising borrowing costs and pressure from higher interest rates challenged the asset class and stifled risk appetite.
Since 2021, investors in beta products tracking market cap-weighted small-cap indexes have had a disappointing experience, with virtually no silver linings like this year’s success of the Magnificent 7 in the large-cap universe.
So, where should investors along the lower end of the equity size spectrum turn after two years of losses? We think there’s value to uncover in small-cap strategies based on fundamentals rather than exclusive broad market ownership.
For those curious about fundamentals, we recently conducted an annual rebalance for the WisdomTree U.S. SmallCap Dividend Index (WTSDI), which is tracked by the WisdomTree U.S. SmallCap Dividend Fund (DES). Let’s assess how its composition and fundamentals changed during our screening and reconstitution processes.
WisdomTree U.S. SmallCap Dividend Index (WTSDI)
The WisdomTree U.S. SmallCap Dividend Index applies a dividend-weighted methodology to the U.S. small-cap market. Beginning with the dividend-paying U.S. equity universe (resulting in the WisdomTree U.S. Dividend Index (WTDI)), we remove the 300 largest companies by market cap to create the WisdomTree U.S. LargeCap Dividend Index (WTLDI). We then create the WisdomTree U.S. MidCap Dividend Index (WTMDI) from the top 75% of market capitalization remaining. The residual 25% of market cap is reserved for a dividend-weighted small-cap basket.
Because of the volatile nature of small-cap equities, we often see more pronounced changes to WTSDI during the annual rebalance, and this year’s was no exception. However, most changes remain consistent with the inherent value bias in the strategy resulting from its dividend emphasis.
Sector Composition – Post-Rebalance Comparison
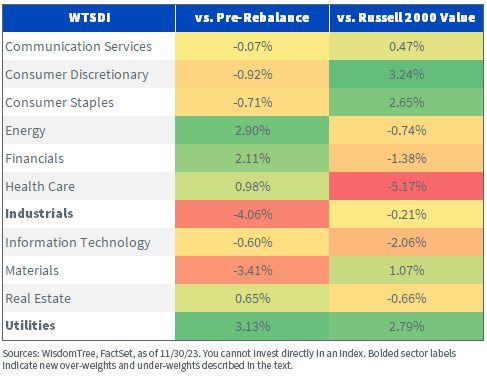
The small-cap Index increased its exposure to Financials, a traditional heavyweight in value-oriented indexes, due to lower valuation ratios and the banking sector’s preference for paying cash dividends. Energy and Utilities, two additional value-oriented sectors, also received notable pickups. These additions primarily came at the expense of Industrials and Materials.
But WTSDI’s sector composition diverges from the Russell 2000 Value Index, which is broader and contains a swath of unprofitable companies.
It remains over-weight in the two Consumer sectors relative to the market, but those over-weights were slightly pared by the rebalance. Materials exhibited the same behavior but to a greater extent. The opposite happened within Energy and Financials, where the post-rebalance pickups helped reduce existing under-weights to the Russell 2000 Value. A new over-weight was established in Utilities, where rebalance additions put WTSDI 2.8% ahead of the market, while Industrials were reduced to approximately market weight.
The sector changes highlight the fluid nature of the U.S. small-cap universe and the value of a fundamental emphasis in a predominantly low-quality market with a prevalence of unprofitable companies.
Weight in Unprofitable Companies over Time
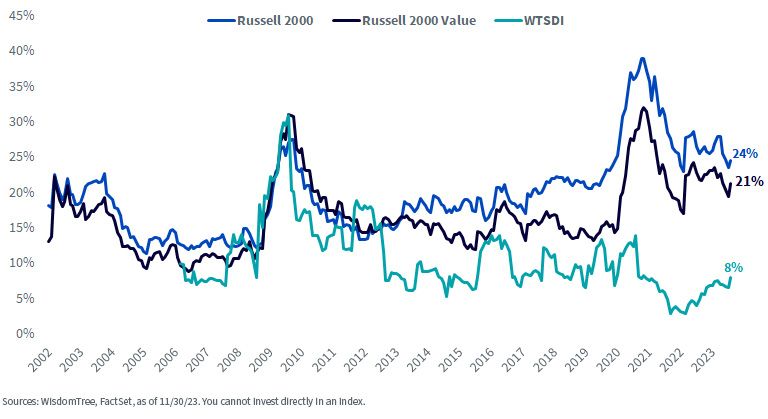
Over the past decade, both the small-cap and small-cap value markets held roughly 20% of index weight in unprofitable companies, on average. Today, they account for one-fifth to one-quarter of each market after peaking at about 40% and 35%, respectively, during the height of the pandemic. WTSDI’s portion, meanwhile, remains below 10%.
Evidently, fundamentals matter for U.S. small caps, and WisdomTree’s annual rebalance for WTSDI illustrates how they are enhanced compared to market cap-weighted composite ownership.
Fundamental Comparison after Rebalance
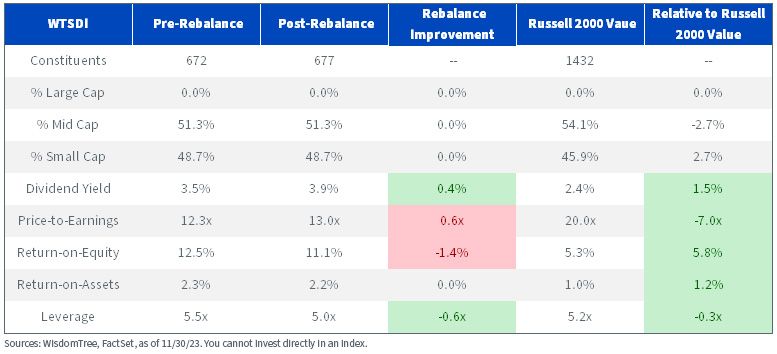
The screening and reconstitution process resulted in a 40-basis-point increase to trailing dividend yield and a reduced leverage multiplier compared to pre-rebalance metrics. Despite the 1.4% decline in ROE, all these measures are considerably better than those of the Russell 2000 Value Index. WTSDI delivers a 1.5% improvement to dividend yield and a 7% combined increase to ROE and ROA that results in a 0.3-point reduction to leverage.
Once again, these enhancements do not cost more in terms of valuation, either. WTSDI’s trailing P/E remains seven points below that of the U.S. small-cap value market.
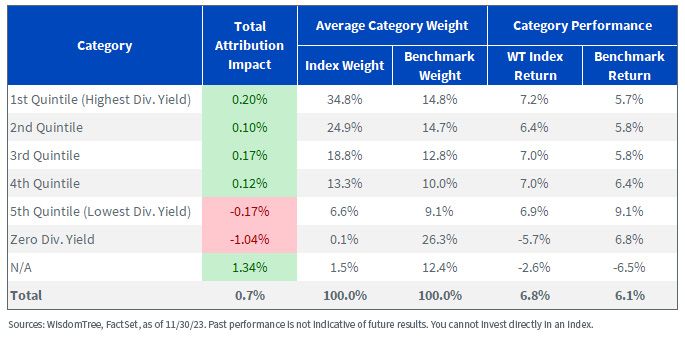
Our methodology has rewarded over the long run as well, where we see the value of dividend-weighting the small-cap market. Since inception in June 2006, WTSDI outperformed the Russell 2000 Value Index by more than 70 basis points per year. Screening for dividends enabled us to select outperforming stocks and reduce the influence of underperformers across the top four quintiles of dividends over the 17-year period. This substantially explained all outperformance.
Dividend Yield Attribution – WTSDI vs. Russell 2000 Value Index – June 2006–November 2023
On to 2024…
Heading into next year, we believe WTSDI can provide compelling opportunities for whatever equity market environment lays ahead, especially once market sentiment reverses in small caps’ favor. Dividend-paying small caps may receive an overdue tailwind as well if prevailing trends in large caps are any indication.
Over the past three years, S&P 500 price returns have largely kept pace with the growth of dividends despite briefly overshooting the fundamentals during 2021. Small caps cannot say the same, however, as the Russell 2000 has only fallen on a price return basis for the last three years, although its trailing dividend growth greatly surpasses that of the S&P.
Fundamental Disconnect: Small Cap Prices down While Dividends up >40% Over the Last 3 Years
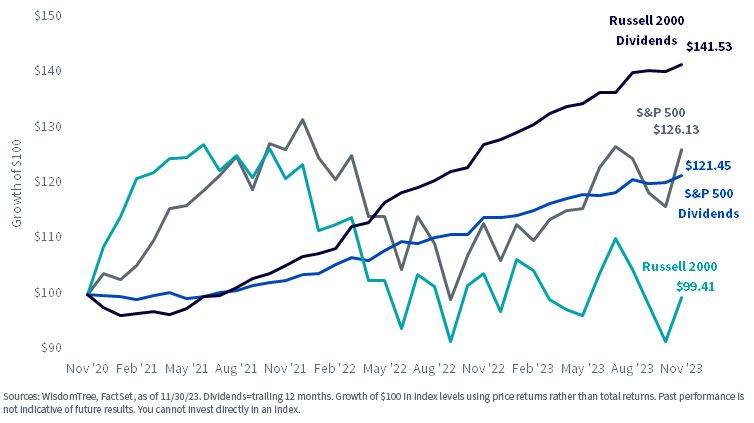
We don’t think this trend can, or should, continue. Once the tide turns in small caps’ favor, we think they will be poised for outperformance.
Between sectoral shifts and fundamental improvements, and positive trends among dividend-paying companies, we are encouraged that dividend-weighting the U.S. small-cap equity market may continue to be additive for a portfolio.
Important Risks Related to this Article
There are risks associated with investing, including the possible loss of principal. Funds focusing their investments on certain sectors and/or smaller companies increase their vulnerability to any single economic or regulatory development. This may result in greater share price volatility. Dividends are not guaranteed, and a company currently paying dividends may cease paying dividends at any time. Please read the Fund’s prospectus for specific details regarding the Fund’s risk profile.
Categories
Related articles
A Rebalance Review for U.S. Large-Cap Dividends

2025 Rebalance: Managing Valuation Risk with Earnings Weighting

December 2025 Rebalance: WisdomTree U.S. Quality Growth Index
U.S. Quality Dividend Growth: Rebalance Summary
A Review of Our 2025 Global Dividend Rebalance

From Tactical to Strategic: 2025 Japan Dividend Rebalance
Rebalancing Back to Value: 2025 Emerging Markets Rebalance

Introducing True Developed International
International Quality Dividend Growth Rebalance
About the contributor

Brian Manby, CFA
Equity Strategist
Brian Manby is an Equity Strategist at WisdomTree and part of the Investment Strategy team.
He is responsible for developing and communicating equity market insights, investment themes, and portfolio strategies that support the firm’s ETF and investment solutions platform. He evaluates sectors, valuations, fundamentals and equity styles to identify investment opportunities and provide actionable perspectives to clients and advisors. He also helps investors understand how WisdomTree’s equity strategies can be used to achieve long-term investment objectives in evolving market environments.
Brian joined WisdomTree in October 2018 as an Investment Strategy Analyst after a few years as a Consultant for FactSet Research Systems, Inc. He earned a B.A. in Economics and Political Science from the University of Connecticut in 2016 and has been a Chartered Financial Analyst since 2022.