
The Hidden Headwind: Small-Cap Balance Sheets
Published October 31, 2023

Equity Strategist
For most of the past two years, the pain of higher interest rates has disproportionately afflicted U.S. small caps.
Since the Federal Reserve began its tightening cycle in earnest at the start of 2021, the Russell 2000 Index has fallen by over 18% through September 2023, compared to more a palatable 7% decline in the S&P 500. Though this year has been stronger for equity markets thus far, the Russell 2000 is up merely 2.5% and still trails the S&P by over 10.5%.
Despite historically low valuations, which is normally our preferred silver lining after steep sell-offs, small caps remain unable to capture any of the positive momentum propelling their larger brethren higher. There are myriad reasons for diverging risk attitudes across the size spectrum, but one pertains to the negative effect of higher interest rates on smaller companies’ income statements and balance sheets.
Beware the Balance Sheet
Small caps are sensitive to interest rates for several reasons, but their liabilities and financing arrangements warrant particular focus.
Due to their size, business lines and inherent riskiness, they often rely more on bank financing for continuing operations and less on bond issuance than large caps. But as long as interest rate volatility is muted and the Fed is not forced to rapidly adjust to changing macroeconomic conditions, there are few headaches for small-cap CFOs.
But we’ve experienced the opposite in the post-pandemic era, and small-cap debt measurements are beginning to illustrate the difficulty of servicing loans in a higher-for-longer interest rate environment.
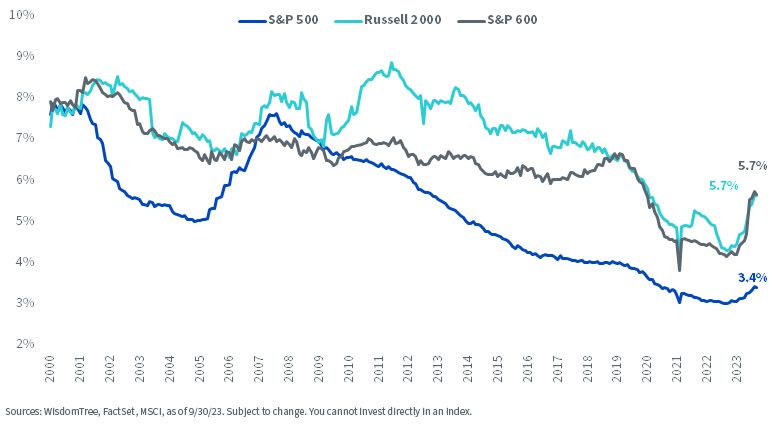
The average interest rate paid on company debt climbed since the start of the year to just under 6% for both the S&P 600 and Russell 2000. These rates are now back to pre-pandemic levels, and we expect they will continue to increase through the end of this year. The S&P 500, by contrast, remains relatively unaffected, with an average rate just under 3.5%.
Cost to Service Debt—LTM Interest Paid on Total Debt (Excluding Financials)
Higher interest expenses are also starting to consume greater portions of trailing earnings before interest and taxes (EBIT) and revenues within the S&P 600 and Russell 2000. Larger companies who tap the bond markets for their loans are able to extend maturities like the typical mortgage refinancer and have been better fortified against these rising costs.
Interest Costs Beginning to Demand More from Revenue
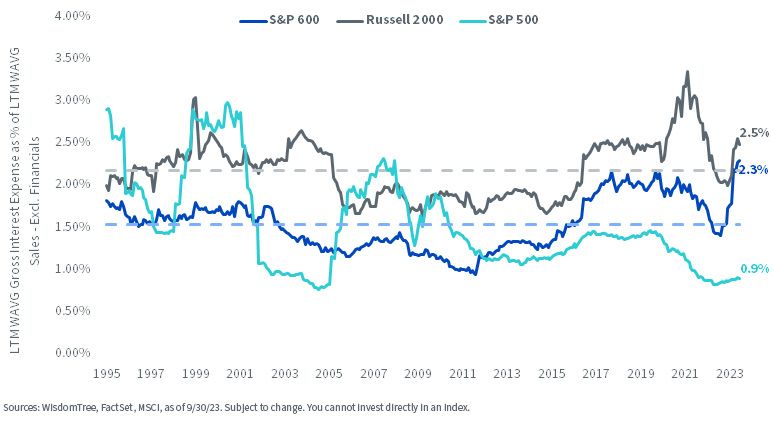
Fortunately, these are still very minor portions relative to sales despite the recent pickup. But after deducting operating costs, greater interest expenses begin to quickly erode EBIT. For both indexes, roughly one of every four dollars of operating earnings will be used to service debt.
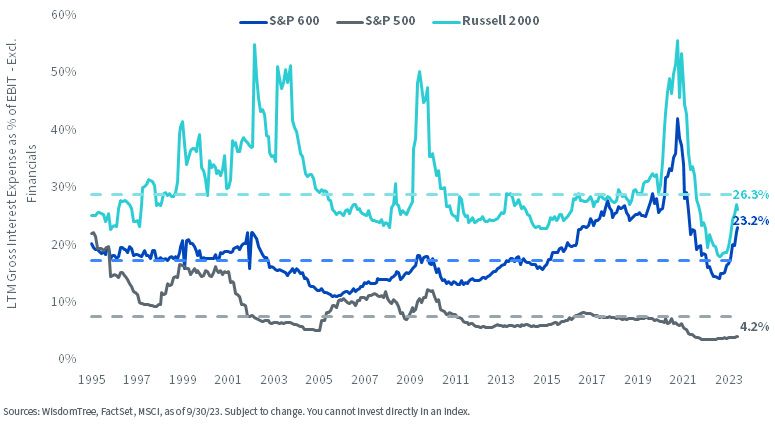
As of now, this is roughly consistent with the longer-term average for the Russell 2000, but it essentially increases the dollar cost of interest expenses from nearly one in six dollars (17.5%) to one in four dollars (23.2%) for the S&P 600.
Near-term risks seem skewed to the downside so long as interest rates remain elevated. Large-cap earnings appear defensive once again, as the proportion needed to service their interest costs has remained relatively flat since 2021.
Rising Interest Costs Beginning to Impact Operating Margins
We remain positive on small caps for longer-term holding periods but acknowledge the challenges presented by higher interest rates. Focus will remain on the health of the economy and the future path of monetary policy from the Fed. Once a pivot to policy easing eventually occurs, a catch-up rally for small caps may be sparked, although that can come with a lower profit outlook as well.
Quality Remains Our Preferred Approach
We are partial to small-cap methodologies that promote high-quality companies in general, but especially with prevailing rate dynamics disproportionately impacting small caps.
Companies with lower leverage and higher operating profitability metrics should weather the storm of higher interest rates better. Most importantly, they provide a valuable cushion for debt service that is absent in lower-quality, less profitable, and more leveraged small caps.
The WisdomTree U.S. SmallCap Quality Dividend Growth Fund (DGRS) illustrates this dynamic well. By marrying two reputable factors in quality and dividend growth, the basket of 300 small-cap stocks scoring the highest within our quality framework exhibits best-in-class return on equity (ROE), return on assets (ROA) and return on sales (ROS) over time.
Note that the below metrics even exceed those of the S&P 600, which is widely considered one of the highest-quality broad, market cap-weighted small indexes in the U.S.
Quality Metrics, as of 9/30/23
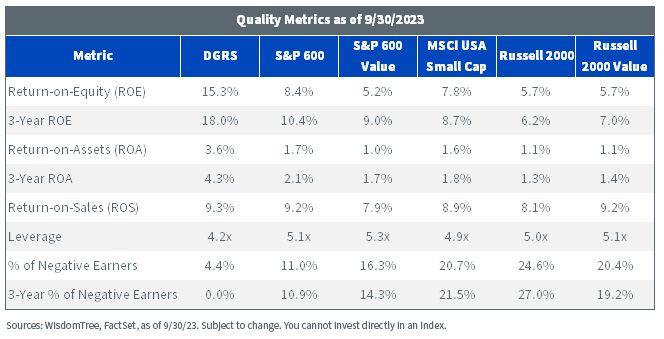
For definitions of terms and indices in the table above, please visit the glossary.
These are the characteristics that may fortify a small-cap allocation and defend its constituents’ balance sheets from the afflictions of higher interest costs. Fortunately, through September, quality strategies are proving their worth as well.
DGRS's index is outperforming the S&P 600 by over 400 basis points, year-to-date, with most of its success attributable to an over-weight allocation in small caps with the highest ROE. Roughly 2.5% of the 4.1% outperformance is the direct result of an over-weight in the most profitable stocks by about 20% versus the S&P 600.
Return on Equity Attribution—WisdomTree SmallCap Quality Dividend Growth Index (WTSDG) vs. S&P 600, 12/31/22–9/30/23
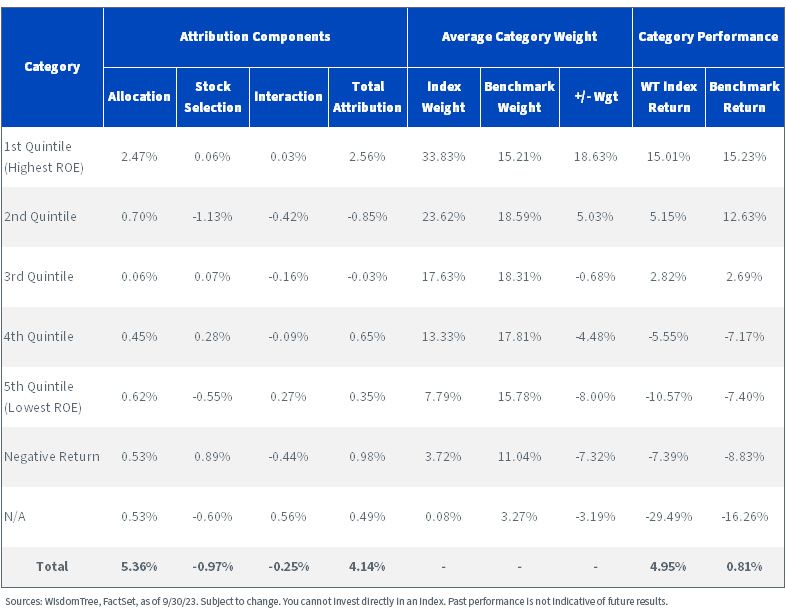
Quality’s true benefit this year is distinguished through the allocation effect, where impacts across the five quintiles by ROE (plus those with negative ROE) are all positive. This is a testament to the methodology’s explicit tilts toward high-quality names and away from low-quality ones at a time when the market is rewarding the most profitable and operationally efficient companies.
We think these trends are here to stay awhile in the higher-for-longer rate environment and believe it would be prudent to rethink existing small-cap allocations in favor of a high-quality approach.
Important Risks Related to this Article
There are risks associated with investing, including the possible loss of principal. Funds focusing their investments on certain sectors and/or smaller companies increase their vulnerability to any single economic or regulatory development. This may result in greater share price volatility. Dividends are not guaranteed, and a company currently paying dividends may cease paying dividends at any time. Please read the Fund’s prospectus for specific details regarding the Fund’s risk profile.
Categories
About the contributor

Equity Strategist
Brian Manby is an Equity Strategist at WisdomTree and part of the Investment Strategy team.
He is responsible for developing and communicating equity market insights, investment themes, and portfolio strategies that support the firm’s ETF and investment solutions platform. He evaluates sectors, valuations, fundamentals and equity styles to identify investment opportunities and provide actionable perspectives to clients and advisors. He also helps investors understand how WisdomTree’s equity strategies can be used to achieve long-term investment objectives in evolving market environments.
Brian joined WisdomTree in October 2018 as an Investment Strategy Analyst after a few years as a Consultant for FactSet Research Systems, Inc. He earned a B.A. in Economics and Political Science from the University of Connecticut in 2016 and has been a Chartered Financial Analyst since 2022.