
The Fundamental Disconnect in Small Caps: Price vs. Dividend Growth
Published December 22, 2023

Equity Strategist
A unique phenomenon has emerged in U.S. small-cap equities. Amid the economic recovery during the post-pandemic environment, U.S. companies continued to pay an increasing amount of dividends to shareholders, without interruption.
Small caps led the charge, growing trailing 12-month dividend totals for the Russell 2000 Index by over 40% since November 2020, a measure that nearly doubled the 21% growth in S&P 500 dividends.
Fundamental Disconnect: Small Cap Prices Down while Dividends Up >40% over the Last 3 Years
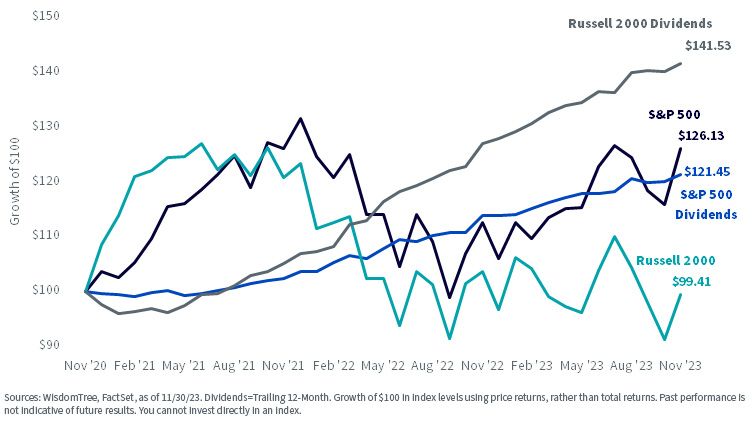
Large-cap equity prices had their ups and downs over the last three years but mostly kept pace with dividend growth during this cycle, despite initially overshooting during the frenzied bull market of 2021. Through November 2023, the S&P 500 price index is up a cumulative 26% over the past three years while its dividends grew 21%. Large-cap markets seemed to appropriately reward this fundamental improvement.
Yet this reward is completely absent in small-cap markets. Russell 2000 dividends grew 41% over the past three years, yet the index is virtually flat since then.
This fundamental disconnect signals small-cap equities are getting nominally cheaper despite significant improvements in a key driver of returns.
Though we cannot forecast when this trend may reverse, we see the Federal Reserve’s eventual pivot to easier monetary policy as a catalyst for a broader small-cap rally. Even the market’s reaction over the first few days after the December FOMC meeting was a step in that direction.
Small caps with dividend growth potential that are resilient to several macroeconomic scenarios warrant further consideration.
Fortunately, we recently rebalanced the WisdomTree U.S. SmallCap Quality Dividend Growth Index (WTSDG), which is tracked by the WisdomTree U.S. SmallCap Quality Dividend Growth Fund (DGRS). This construct applies a quality focus to the dividend-paying small-cap market to provide dividend growth potential for volatile periods.
Let’s assess how its composition and fundamentals changed during our screening and reconstitution processes.
WisdomTree U.S. SmallCap Quality Dividend Growth Index (WTSDG)
WTSDG expands upon our flagship dividend-weighted methodology by incorporating additional parameters to improve the quality profile and dividend growth potential of the U.S. small-cap universe.
Beginning with the WisdomTree U.S. SmallCap Dividend Index (WTSDI) universe, we select the top 50% of companies with the best combined rank of growth and quality factors based on a composite score. The growth component of this score includes longer-term earnings growth expectations while the quality component assesses three-year trend observations of return on equity (ROE) and return on assets (ROA). The result is a stock basket that remains value-biased yet features “growth-lite” characteristics that bring it closer to a core small-cap allocation from a stylistic standpoint.
Sector Composition: Post-Rebalance Comparison
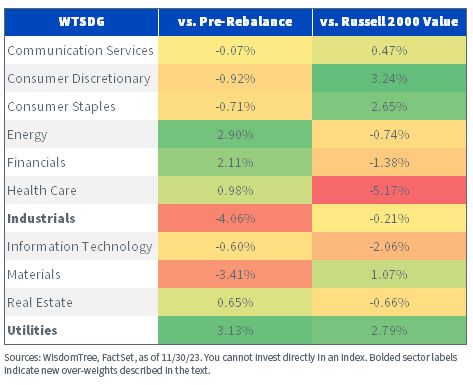
After the rebalance, WTSDG’s changes are sizable yet primarily concentrated within a few sectors. Relative to pre-rebalance data, the most notable additions are in Energy and Communication Services, while Financials, Materials and Real Estate headline the reductions.
Compared to the Russell 2000 Index, however, the effects are more visible. Negligible changes from the pre-rebalance data did little to impact a large existing over-weight in Consumer Discretionary or large under-weights in Health Care and Information Technology versus the broader small-cap market. Notable pickups to Communication Services and Energy, however, resulted in new over-weights in those sectors, while over-weights in Industrials and Consumer Staples increased as well.
Financials was essentially diminished to market weight through the 6.5% reduction at the rebalance, while an existing under-weight in Real Estate was reduced further and an over-weight in Materials was pared.
Within this sector mix, WTSDG delivers slightly greater style diversification than the value-oriented indexes discussed earlier. Though it remains under-weight in small-cap growth heavyweights in Health Care and Informational Technology, the emphasis on high-quality, dividend-paying companies opens it up more to the Consumer Staples and Discretionary sectors. It also trims its exposure to Financials and Utilities, two sectors that are more prominent in value indexes.
The additional focus on quality rewarded WTSDG’s fundamentals after the rebalance as well.
Fundamental Comparison after Rebalance
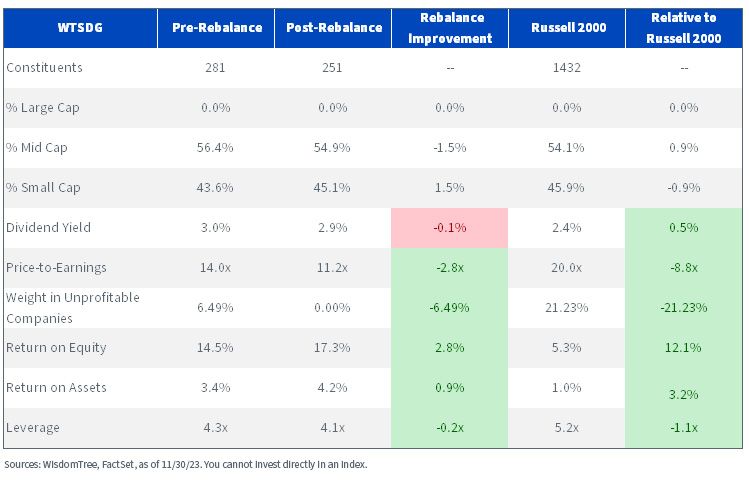
The rebalance once again reduced the weight in unprofitable companies back to zero, illustrating the emphasis on efficient companies with robust and proven operations. This is a key differentiator of the marriage between quality and size, as the Russell 2000 is 21% laden with profitless companies.
Meanwhile, ROE and ROA grew nearly 4% combined relative to pre-rebalance data, and over 15% versus the market. This tandem also reduced overall leverage multiples by over one point versus the Russell 2000, which is beneficial while rising interest costs exact a toll on small-cap balance sheets.
Normally, investors might expect that an improved quality profile with innate defensive characteristics would require a premium valuation to the market, but WTSDG is an outlier. The rebalance trimmed nearly three more points off its price-to-earnings (P/E) multiple, leaving it almost nine points lower than the overall small-cap market.
We think this combination of improved quality at a significant discount provides an attractive entry point for allocators looking for broader market participation in 2024.
Important Risks Related to this Article
There are risks associated with investing, including the possible loss of principal. Funds focusing their investments on certain sectors and/or smaller companies increase their vulnerability to any single economic or regulatory development. This may result in greater share price volatility. Dividends are not guaranteed, and a company currently paying dividends may cease paying dividends at any time. Please read the Fund’s prospectus for specific details regarding the Fund’s risk profile.
About the contributor

Equity Strategist
Brian Manby is an Equity Strategist at WisdomTree and part of the Investment Strategy team.
He is responsible for developing and communicating equity market insights, investment themes, and portfolio strategies that support the firm’s ETF and investment solutions platform. He evaluates sectors, valuations, fundamentals and equity styles to identify investment opportunities and provide actionable perspectives to clients and advisors. He also helps investors understand how WisdomTree’s equity strategies can be used to achieve long-term investment objectives in evolving market environments.
Brian joined WisdomTree in October 2018 as an Investment Strategy Analyst after a few years as a Consultant for FactSet Research Systems, Inc. He earned a B.A. in Economics and Political Science from the University of Connecticut in 2016 and has been a Chartered Financial Analyst since 2022.