

Narrow Market Leadership Doesn't Equal Frothy Valuations
Published November 8, 2023

Matt Wagner, CFA
Director, Research
Earnings season is nearing a close. Of S&P 500 companies, 424 have reported results, representing 87% of the Index.
Better-than-expected earnings flipped estimated year-over-year earnings growth from slightly negative (-0.01%) as of October 2 to 5% growth as of November 7.
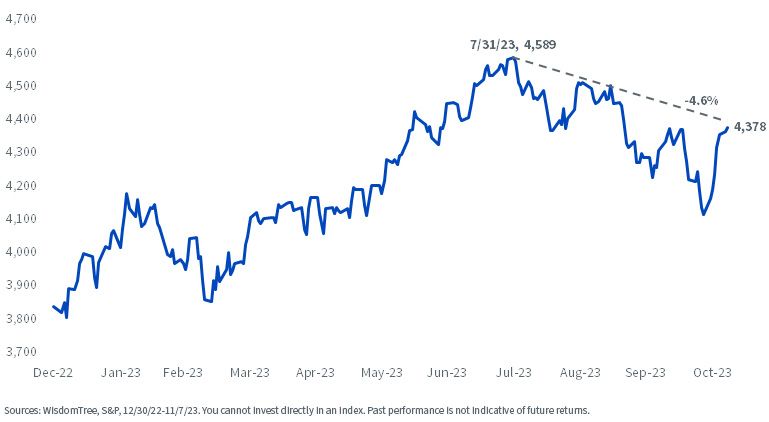
The improved earnings picture coupled with a drop in interest rates have helped the index recover from correction territory (down over 10%) to down 4.6% from its end of July high.
S&P 500 Price Index
Narrow leadership, signaling an unhealthy market dynamic, has been one of the most discussed narratives of the year.
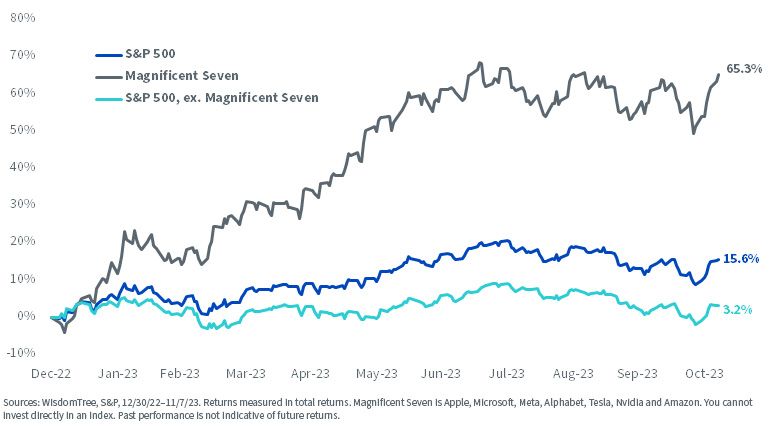
Excluding the so-called “Magnificent Seven” (Apple, Microsoft, Meta, Alphabet, Tesla, Nvidia and Amazon) wipes out the much of the index’s 15.6% year-to-date return.
Year-to-Date Total Returns
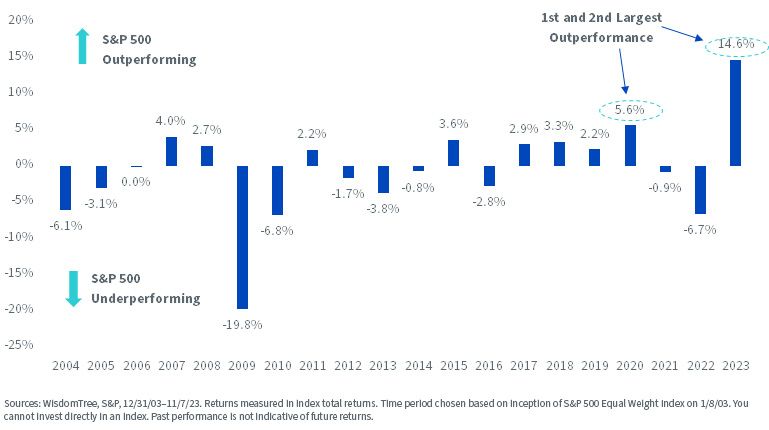
There’s another way of assessing how this narrow leadership stacks up versus history—this year has the widest spread in performance between the S&P 500 and the S&P 500 Equal Weight Index since 2004. The 14.6% outperformance is more than twice the second-greatest outperformance of 5.6% in 2020.
S&P 500 Index vs. S&P 500 Equal Weight Index
The important question for investors is to what extent the returns in the Magnificent Seven are driven by hype related to the largely unknowable benefits of artificial intelligence (AI) in the years to come, and to what extent we can see evidence in fundamentals to justify the gains.
Valuations and Fundamentals
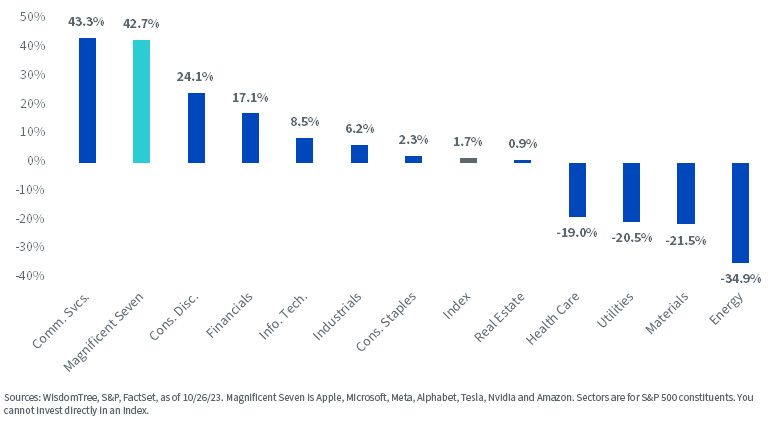
The Magnificent Seven is anticipated to grow earnings by 43% compared to the year-ago period, well ahead of the 1.7% growth for the S&P 500.
The biggest contributor to the growth is Meta (over 150% earnings growth), with Tesla the only detractor with a year-over-year earnings decline of 37%.
3Q23 vs. 3Q22 Earnings Growth
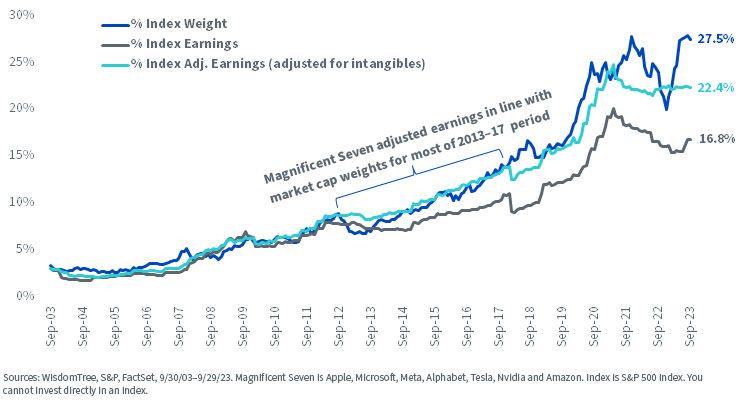
Related to the fact that a handful of companies are driving the returns of U.S. equities this year, is that this same group has grown to make up over 27% of the index.
One way to put that weight into the context of underlying fundamentals is to show the percentage of total S&P 500 Index earnings these companies make up.
At just under 17% of the total index earnings (on a trailing 12-month basis), the roughly 11% gap of index weight and index earnings is 8% higher than the 3% difference on average historically.
Using an earnings measure that adjusts for investments in intangible assets (brands, supply-chain management, well-trained sales staff, superior technology, etc.) we see a closer relationship between index weight and index earnings (less than 1% difference on average).
Looking at this measure of earnings relative to market-cap weights, the sell-off of this group of companies in 2022 looks like it had perhaps been overdone.
Magnificent Seven Market Weight vs. Earnings Stream Weight
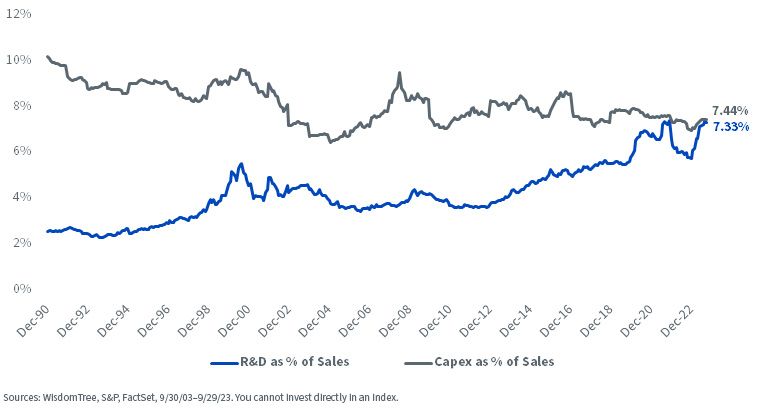
The below chart provides some context to the importance of the issue of adjusting earnings and asset values for investments in intangible assets.
In 1990, approximately 10% of sales went to capital expenditures (or capex, a proxy for investment in physical assets) and just over 2% went to research and development (or R&D, a proxy for investment in intangible assets). Over the last 30 years, we see a decline in spending on capex and a corresponding increase to R&D.
Shifting from Capex Economy to R&D within S&P 500
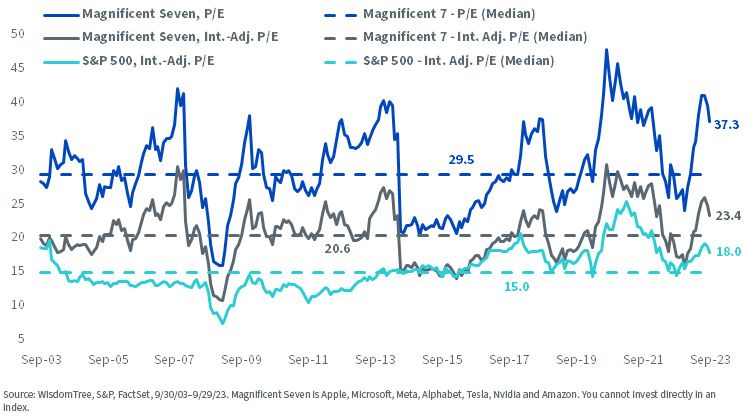
If we adjust earnings to account for the investments in intangible assets—treating R&D expenditures the same way as capex in terms of capitalizing/depreciating—we see the price-to-earnings multiple on the Magnificent Seven decrease from 37 times to a far more modest 23 times.
Magnificent Seven Not As Expensive with Intangibles-Adjusted Earnings
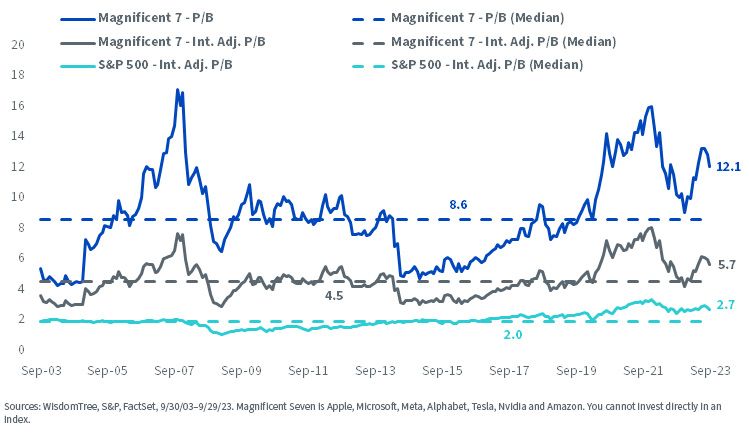
The impact of using the standard price-to-book versus intangibles-adjusted price-to-book is an even greater contrast.
The intangibles-adjusted price-to-book for the Magnificent Seven is 5.7 times, a premium to the historical median of 4.5 times, but less of an eye-popping valuation than the traditional price-to-book implies.
Price-to-Book Valuation Adjustments
Even with the intangibles-adjusted valuations, the Magnificent Seven basket still trades at a premium relative to its own history and the S&P 500.
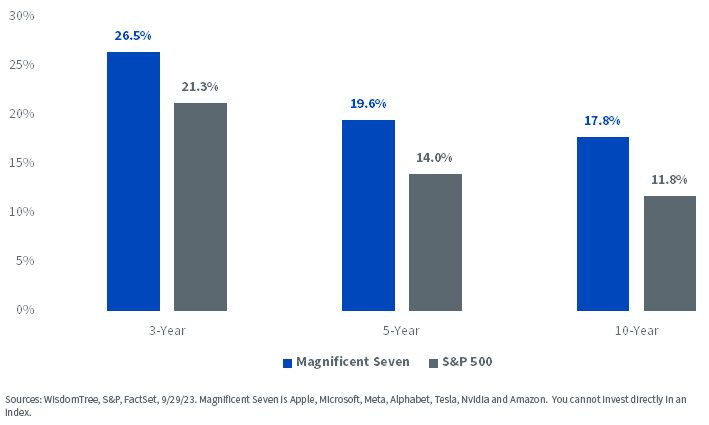
Looking at trailing 3-, 5- and 10-year historical earnings growth, the premium valuations for the Magnificent Seven appear justified by the consistently higher growth.
Historical Annualized Earnings Growth
WisdomTree U.S. Quality Growth Index
The WisdomTree U.S. Quality Growth Index is a market capitalization-weighted Index that consists of companies with high quality and growth characteristics. The top 500 U.S. companies by market cap are ranked on a composite score of those two fundamental factors.
The Index is comprised of the 100 U.S. companies (first quintile) with the highest composite scores.
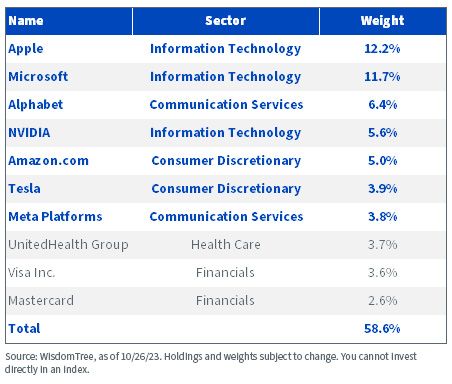
The top seven holdings in the Index, which rebalances semi-annually in June and December, are the Magnificent Seven.
Index Top Holdings
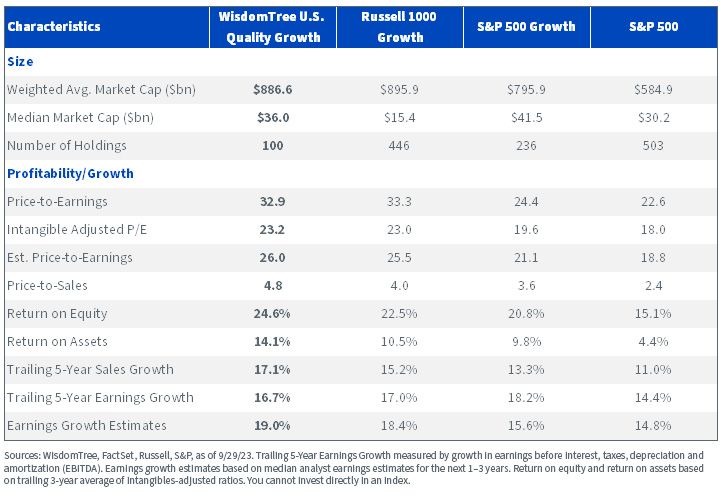
Using the intangibles-adjusted P/E reduces the Index P/E from 32.9 times to 23.2 times—a valuation in line with the Russell 1000 Growth Index.
The Quality Growth Index’s higher valuations are accompanied by higher profitability metrics (ROE and ROA) and growth metrics (trailing sales/earnings and growth estimates).
This Index of mega-cap quality growth stocks has shown remarkable resilience in 2023 and outpaced other common growth benchmarks.
The Index was designed to leverage new research on the benefits of updating the profit stream and profitability ratios to include these intangible adjustments in the definition of both profits and book value. We think having the best definition of factors can make a meaningful difference on performance over time and this year is a good illustration of that.
The WisdomTree U.S. Quality Growth Fund (QGRW) seeks to track the price and yield performance, before fees and expenses, of the WisdomTree U.S. Quality Growth Index.
Index Characteristics
Important Risks Related to this Article
There are risks associated with investing, including the possible loss of principal. Growth stocks, as a group, may be out of favor with the market and underperform value stocks or the overall equity market. Growth stocks are generally more sensitive to market movements than other types of stocks. The Fund is non-diversified. As a result, changes in the market value of a single security could cause greater fluctuations in the value of Fund shares than would occur in a diversified fund. The Fund invests in the securities included in, or representative of, its Index regardless of their investment merit. The Fund does not attempt to outperform its Index or take defensive positions in declining markets and the Index may not perform as intended. Please read the Fund’s prospectus for specific details regarding the Fund’s risk profile.
Categories
Related articles

Built for Any Market: How Blending Growth and Value Creates a Stronger Core

The Company at the Center of the AI Economy

A Dog, a Diagnosis and a Different Way to Understand AI

Are Two Complementary Strategies Continuing to Create a Better Core in 2026?
December 2025 Rebalance: WisdomTree U.S. Quality Growth Index
Growth vs. Value: Capturing Complementary Factor Exposure

Introducing Global ex-U.S. Quality Growth
Taming Style Rotation Whiplash
Big Tech's Relentless Momentum Continues
About the contributor

Matt Wagner, CFA
Director, Research
Matt Wagner joined WisdomTree in May 2017 as an Analyst on the Research team. He currently serves as a Director, where he supports the creation, maintenance, and reconstitution of WisdomTree’s indexes and actively managed ETFs. Matt began his career at Morgan Stanley, working as an analyst in Treasury Capital Markets from 2015 to 2017, focusing on unsecured funding planning, execution, and risk management. He graduated magna cum laude from Boston College in 2015 with a B.A. in International Studies, concentrating in Economics. In 2020, he earned a Certificate in Advanced Valuation from NYU Stern. He is also a Chartered Financial Analyst (CFA) charterholder.