
Bonds: A H1 2023 Report Card


Yes, schools are out for summer vacation, but there’s no resting in the fixed income arena. After arguably the worst year on modern record in 2022, it was our belief that this year was set up to be a potential positive experience for the bond investor. And, despite continued rate hikes from the Federal Reserve and other global central banks, fixed income total returns have indeed moved back into the plus column thus far in 2023.
Let’s take a look at the first-half report card.
Fixed Income Total Returns
Unfortunately, in order to gain some perspective on this year’s developments so far in the bond market, we do need to take a look back at the ‘year that should not be named’…2022. In other words, any positive performances here in 2023 must be looked at in the context of just how ‘bad’ 2022 actually was.
As I wrote at the time, there was no place for the fixed income investor to hide last year, with the notable exception of U.S. Treasury (UST) floating rate notes (FRNs). The lion’s share of total returns in key global bond arenas ended up not just on the negative side of the ledger, but with many entering double-digit negative territory.
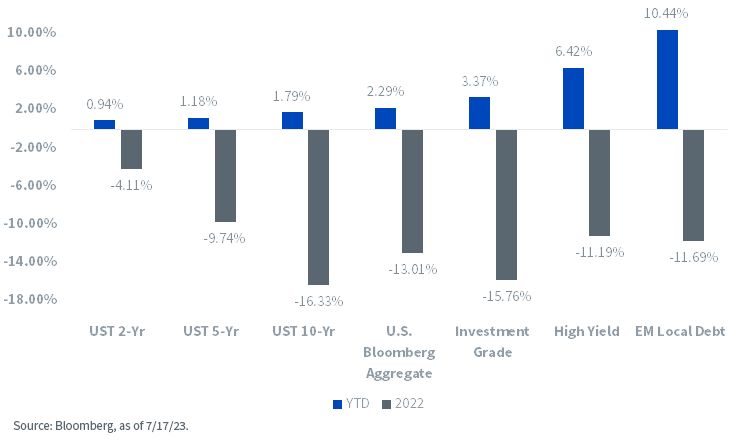
The best place to start would be the U.S. Bloomberg Aggregate Index (Agg), otherwise known as the benchmark for fixed income markets. In 2022, the Agg plummeted by 13%, as the four major areas that make up this index all struggled mightily. Through the first two weeks of July this year, the Agg has managed to rebound by almost 2.3%. While this performance does not come close to making up for last year’s loss, it’s still nice to be back in the plus column.
Similar developments can be found in the three closely watched sectors of the UST market; the 2-, 5- and 10-Year areas. In 2022, each of these sectors was negative, with the magnitude increasing with maturity, ranging from -4.1% for the 2-Year to as low as -16.3% for the 10-Year. Here in 2023, positive total returns have been registered anywhere from almost 1% (UST 2-Yr) to 1.8% (10-Yr). Within the U.S. corporate bond universe, the results have been somewhat better, especially in high yield (HY). In fact, U.S. HY has posted the best showing thus far, rising by a little more than 6.4%, following a 2022 decline of 11.2%. For investment grade, the positive return through mid-July is a bit more modest, coming in at 3.4%, as compared to last year’s nearly 16% shortfall.
From a more global perspective, the gold medal goes to emerging markets (EM) local debt. Indeed, EM local has witnessed a robust gain of 10.4% here in 2023, getting closer and closer to completely reversing last year’s decrease of 11.7%.
Conclusion
Obviously, the results outlined in this blog post are, to some extent, yesterday’s news. The natural question is where are we going from here? With the Fed, and perhaps other global central banks, nearing the end of their respective rate hike cycles, inflation continuing to cool and economic growth softening, it seems reasonable to expect fixed income returns will remain in positive territory through the second half of this year.
Share & Comment
Popular Posts
Categories
Related Links