
To Capture a Value Rotation, Make Sure You Have Value Exposure!


After the global financial crisis of 2008/09, U.S. equities—particularly growth-oriented U.S. equities—went on a run. For an extended period in 2022, it started looking like the growth rally was over and the value cycle had begun.
Periods of growth or value outperformance and underperformance tend to unfold over years. It would be rare for investors to look at long-term charts and see quick shifts in value/growth leadership. If history is a guide, we can think of two logical scenarios now unfolding:
- Scenario 1: 2022 was a blip and the growth rally is really just continuing. The world’s largest tech companies are pushing markets higher and value is relegated to underperformance.
- Scenario 2: The first half of 2023 is the blip and the value rotation that many investors caught onto in 2022 will pick back up after this shorter period of growth outperformance.
In this piece, we focus on those who believe that the value rotation is coming back, that is, Scenario 2. We noted in a prior blog post that something ‘weird’ is happening in the relationship between the S&P 500 and S&P 500 Value indexes, and we extend some of that analysis here.
Analytical Framework: Funds & Indexes
Within this piece, we reference:
- iShares Core S&P 500 ETF (ticker: IVV), which tracks the returns, after fees and expenses, of the S&P 500 Index.
- iShares S&P 500 Value ETF (IVE), which tracks the returns, after fees and expenses, of the S&P 500 Value Index.
- WisdomTree U.S. LargeCap Dividend Fund (DLN), which tracks the returns, after fees and expenses, of the WisdomTree U.S. LargeCap Dividend Index
- WisdomTree U.S. High Dividend Fund (DHS), which track the returns, after fees and expenses, of the WisdomTree U.S. High Dividend Index.
The critical discussion relates IVE, DLN and DHS—all strategies having varying degrees of value-type exposure—back to IVV in terms of performance and valuation.
As we saw in a prior post, if Microsoft is the top holding of the S&P 500 Value Index by a significant margin (and also of IVE), it has implications for the relative discounts and ‘true’ value tilt—which can be in the eye of the ‘beholder’ or index methodology.
The Setup: Performance in the First Half of 2023
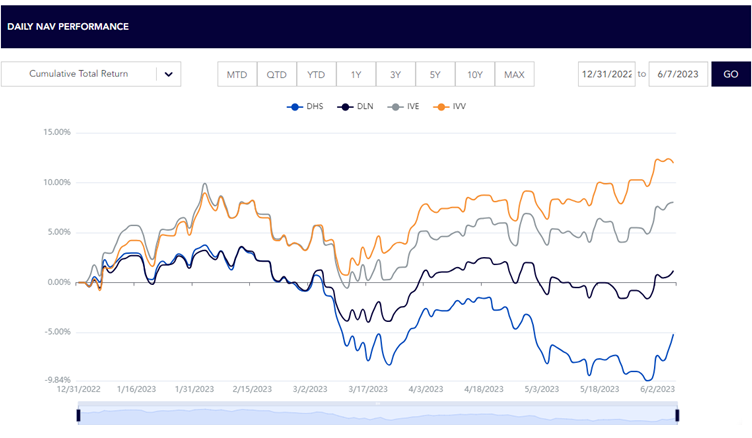
First, we show year-to-date performance in 2023.
- IVV returned nearly 12%—from a narrow subset of large, tech-oriented companies that includes Microsoft.
- IVE returned greater than 8% over the same period, driven by top 10 exposures to Microsoft, Meta Platforms and Amazon.com. We also note that the tenth position in IVE was actually Netflix, not a company normally at the tip of a value investor’s tongue.
- DLN was up 1.18% over the period, whereas DHS was down 5.17%.
- If a small subset of large tech companies is going to lead the U.S. equity market, DLN may be able to catch Apple and Microsoft—payers of significant dividends—but DHS is unlikely to catch the major tech ‘growth’ companies, due to the nature of its Index focusing only on higher yielding dividend-payers.
Figure 1a: Standardized Performance as of March 31, 2023
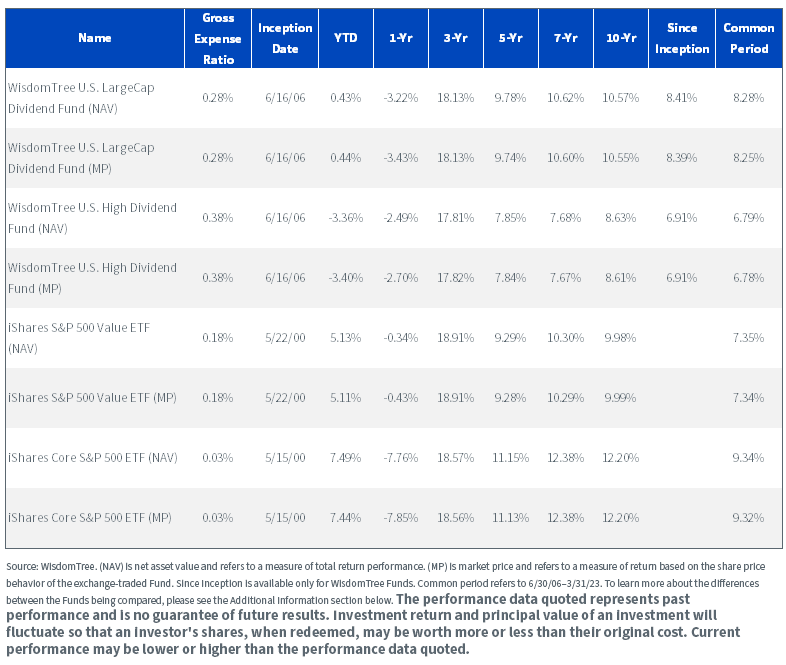
For the most recent month-end and standardized performance and to download the respective Fund prospectuses, click the relevant ticker: DHS, DLN, IVE, IVV.
Figure 1b: Zooming in on Year-to-Date 2023 Performance
‘Value’ Is Usually Defined by Fundamental Metrics
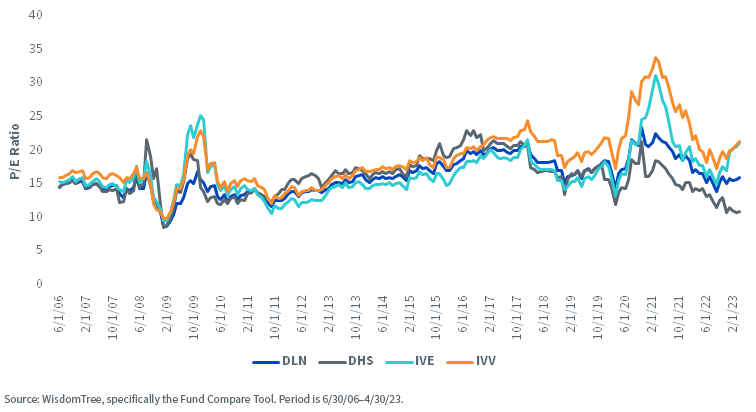
The price-to-earnings (P/E) ratio is likely the most widely followed of the different metrics used to denote whether a stock, index or fund is expensive or inexpensive.
IVV, IVE, DLN and DHS all contain large, established, profitable companies—for the most part—so it is appropriate to look at P/E multiples. Figure 2 shows:
- None of the strategies is ‘most expensive’ or ‘least expensive’ on a P/E basis for the full time series.
- From late-2021 to early-2022, DHS’s P/E ratio was quite clearly declining, and it is getting close to single-digit territory at present.
- IVE’s P/E ratio has increased significantly from late-2022. We know that the S&P 500 Value Index (tracked by IVE) went through a reconstitution that was responsible for getting companies like Microsoft, Amazon.com, Meta Platforms, Salesforce, Cisco and Netflix into the top 10 holdings. IVE’s P/E ratio is looking very similar to that of IVV, the Fund that tracks the return of the broader S&P 500 Index.
Key Question: If an investor is looking for value, does it make sense to search for it in a strategy with a similar P/E ratio to the broad benchmark?
Figure 2: Divergence in Price-to-Earnings (P/E) Ratios among Value-Oriented Funds
How Does the Present Compare to History?
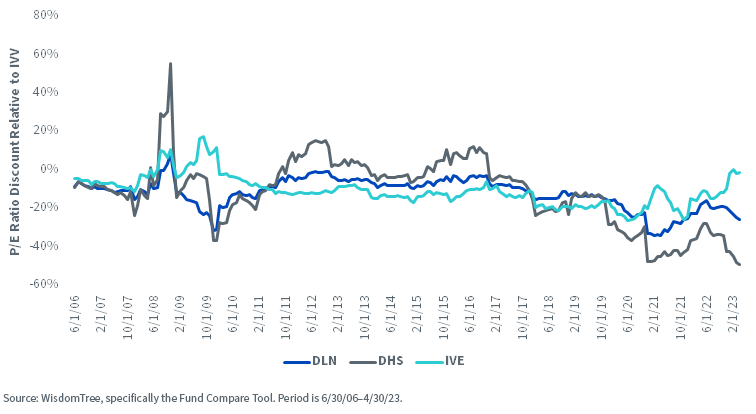
It is not often that a value index has a P/E ratio higher than the market—particularly without a recession that might result in value indexes having temporarily depressed earnings.
Right now, everyone is waiting for a recession that has yet to materialize.
- In fact, the last time that IVV (S&P 500) and IVE (S&P 500 Value) had the same P/E ratio (or IVE was a bit higher), it was during the global financial crisis of 2008/09—when earnings collapsed at the big banks and cyclical stocks.
- From late-2017 to late-2021, IVE’s P/E ratio was typically at a 20% discount to the broad market. The average discount since 2006 has been 10.5%.
- DHS is in wide discount territory: DHS’s P/E ratio is at a discount of around 50% to IVV, for the first time since its inception on June 16, 2006, approximately 17 years ago. This is an extreme valuation discount and perhaps an opportunity.
- DLN’s P/E ratio is at an approximately 25% discount to IVV, while its average discount has been 12.1%.
Figure 3: Valuation Discounts across Various Value Indexes
Conclusion: For Value Exposure, Make Sure You Know What’s under the Hood
The value factor could struggle if the economy deteriorates and short-term earnings come under pressure. However, in our view, those looking for tools to implement a value thesis should hold IVE’s metaphorical feet to the fire, and recognize that an exposure like DHS seems to be very heavily loaded toward stocks currently out of favor, and is thus approaching that venerated single-digit P/E that causes many value investors to salivate.
Figure 4: Further Information Supporting the Comparison of the Different Funds
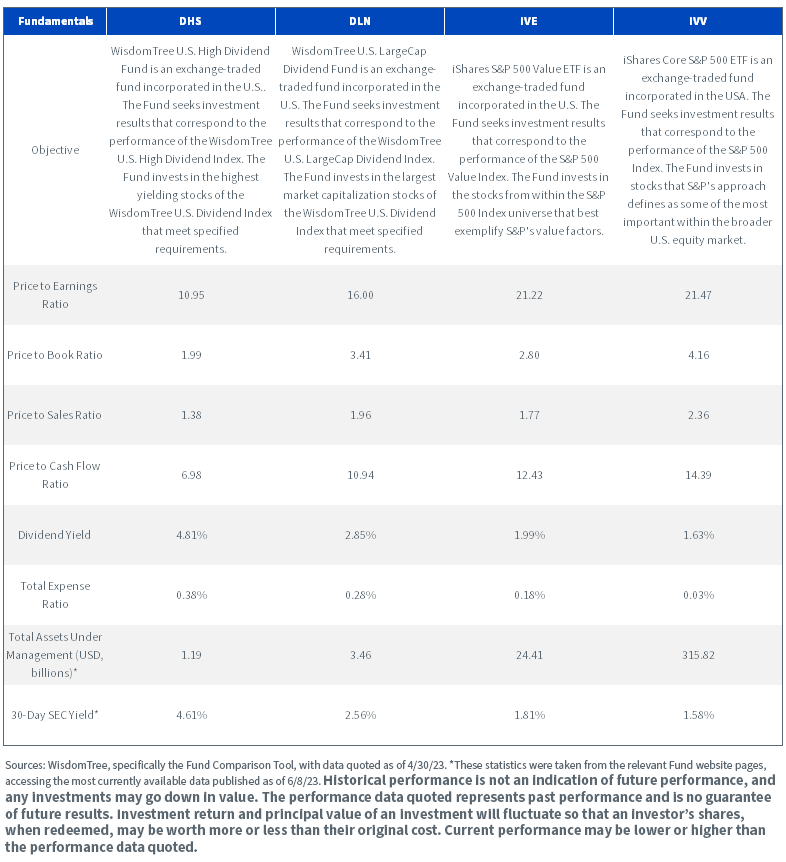
For the most recent month-end and standardized performance and to download the respective fund prospectuses, click the respective ticker: DHS, DLN, IVE, IVV.
If you’re interested in diving more into the comparison of these Funds, please check out our Fund Compare Tool.
Important Risks Related to this Article
There are risks associated with investing, including the possible loss of principal. Funds focusing their investments on certain sectors increase their vulnerability to any single economic or regulatory development. This may result in greater share price volatility. Dividends are not guaranteed, and a company currently paying dividends may cease paying dividends at any time. Please read each Funds’ prospectus for specific details regarding each Funds’ risk profile.Share & Comment
Popular Posts
Categories
Related Links
Christopher Gannatti began at WisdomTree as a Research Analyst in December 2010, working directly with Jeremy Schwartz, CFA®, Director of Research. In January of 2014, he was promoted to Associate Director of Research where he was responsible to lead different groups of analysts and strategists within the broader Research team at WisdomTree. In February of 2018, Christopher was promoted to Head of Research, Europe, where he was based out of WisdomTree’s London office and was responsible for the full WisdomTree research effort within the European market, as well as supporting the UCITs platform globally. In November 2021, Christopher was promoted to Global Head of Research, now responsible for numerous communications on investment strategy globally, particularly in the thematic equity space. Christopher came to WisdomTree from Lord Abbett, where he worked for four and a half years as a Regional Consultant. He received his MBA in Quantitative Finance, Accounting, and Economics from NYU’s Stern School of Business in 2010, and he received his bachelor’s degree from Colgate University in Economics in 2006. Christopher is a holder of the Chartered Financial Analyst Designation.