
The DuPont Analysis: One of the Most Powerful Concepts in Finance


This article is relevant to financial professionals who are considering offering model portfolios to their clients. If you are an individual investor interested in WisdomTree ETF Model Portfolios, please inquire with your financial professional. Not all financial professionals have access to these model portfolios.
If, like me, you are a reader of my colleague Jeff Weniger’s blog posts and social media posts, you know he makes regular references to “The DuPont Analysis.” Those (also like me) with a background in corporate finance or commercial banking know exactly what he is referencing. But, given its relevance to the WisdomTree product suite and how we think about our Model Portfolios, I thought it would be worthwhile to offer a “primer” on what it is and why it matters.
The DuPont Analysis was created (naturally) by the DuPont Company back in the 1920s. The genesis idea is that the objective of any given firm is to maximize return on equity (ROE)—the return to shareholders on their invested capital.
It then breaks down ROE into three fundamental components that evaluate the profitability, operational efficiency and leverage of a given company. While it has myriad offshoots and derivatives that go increasingly “into the weeds,” the fundamental “equation” breaks down like this:

Let’s look at each component:
1. Net Income/Sales: This is a measure of profitability—how much net income do you generate for each unit of sales? There is no “correct” answer to this: a large manufacturing company (e.g., Boeing) may generate huge net income on each airplane sold, while a fast-food franchise (e.g., McDonald’s) may generate a small level of net income on each burger sold—but it sells far more burgers each year than Boeing sells airplanes. So, the metric is relevant to each company’s peers. How profitable are you relative to your peers with respect to net income per unit of sale?
2. Sales/Assets: This is a measure of operational efficiency—what level of sales do you generate relative to your reported assets? While, again, this varies from sector to sector and industry to industry, the bottom line is intuitive—you are doing better than your peers if you generate more sales relative to your asset base.
3. Assets/Equity: This ratio is a measure of financial leverage—it indirectly measures how much debt with respect to equity you carry on your balance sheet relative to your asset base. While there are theories1 that posit that investors should not focus on the capital structure of a company but rather on the present value of future cash flows, most investors intuitively understand that the more debt (leverage) relative to equity a company holds, the more susceptible it is to market or economic downturns. So, a company with a lower assets/equity ratio (i.e., more equity per unit of assets) may have a better ability to withstand economic or market disruptions.
Why Does Any of This Matter?
If you know WisdomTree, you know we are the “more than beta” ETF shop. Almost all our products, and therefore our Model Portfolios, have distinct factor tilts embedded into them, such as value, dividends and size.
And quality. When we say “quality,” we mean companies with stronger balance sheets, earnings and cash flows. Many, if not most, of our products are filtered through a “composite risk score”, which weeds out lower-quality companies and results in custom Indexes that we then build and manage our ETFs around.
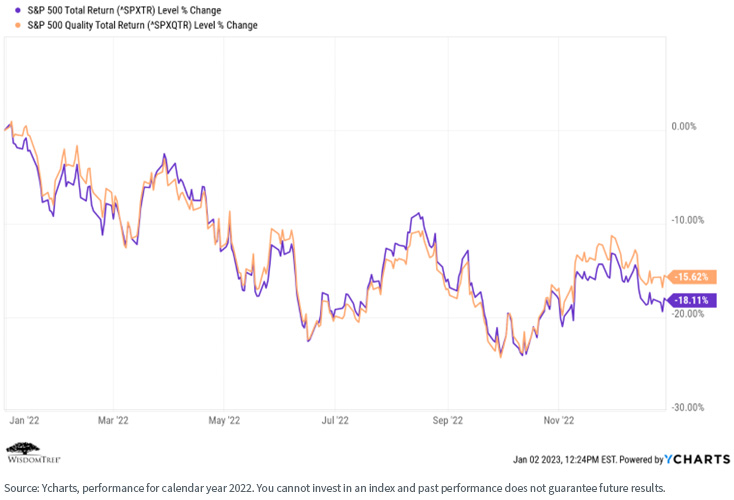
Our “house view” is that 2023 will be a year in which quality becomes increasingly important. As we sail into uncertain and volatile economic and market seas, companies with better balance sheets, earnings and cash flows should be better able to withstand whatever the market environment throws their way.
We saw signs of this in 2022 in both large-cap stocks:
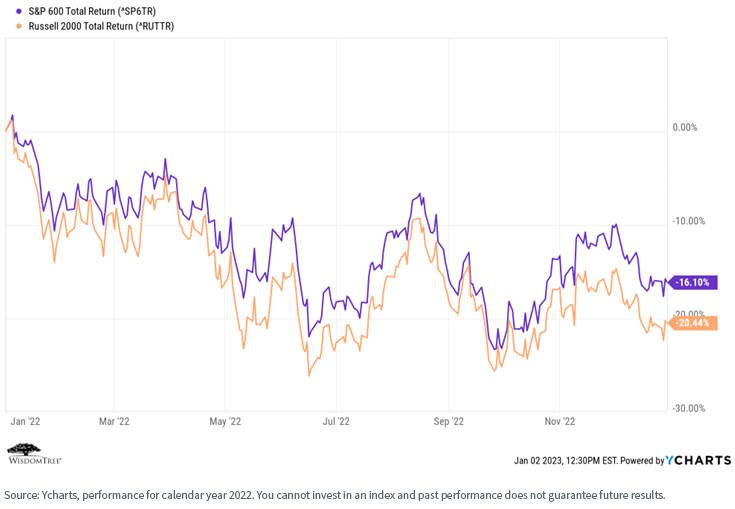
And especially small-cap stocks (the S&P 600 Index is considered a “higher quality” index than the Russell 2000 Index because it filters out a higher percentage of negative earnings companies):
Conclusion
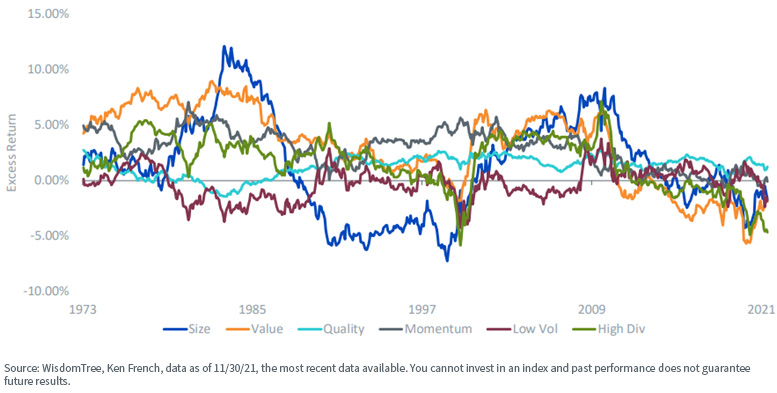
The following chart illustrates comparative factor performance for the S&P 500 Index. Focus on the teal-colored line, which represents the quality factor. Specifically note that, while it rarely has been the best or worst performing factor, it has been the most consistent—it performed regardless of market environments.
Rolling 10-Year Excess Return vs. Market
During the period between the global financial crisis of 2008 and, roughly, November 2021, a low interest rate environment powered large-cap growth stocks. The last two years of this rally—2020–2021—were also marked by a distinct “junk rally”; that is, the market rewarded companies that were lower quality, delivered few (if any) dividends and were dependent on low interest rates to support higher P/E multiples, since distant future cash flows discounted at low rates = higher present value of those cash flows.
But times have changed. Over the past 12+ months, interest rates have moved steadily higher, and fundamentals have come back into popularity. Investors have shown a distinct preference for value and dividends—and quality. We believe this trend will continue for several years at least.
This is why we are optimistic about the relative performance of the WisdomTree product set and our Model Portfolios, as they tilt exactly toward the factors we believe will be rewarded for many years.
In other words, higher quality = better resilience in what we believe will be a volatile and uncertain economic and market environment.
The DuPont Analysis, though simple in design, remains one of the most powerful analytical concepts in all of finance. My colleagues and I have been in the investments and corporate finance game a long time—we’ve all lived through multiple economic and investment regimes, including recessions and severe market disruptions. As the above chart supports, we will never apologize for having a quality tilt within our products and portfolios.
The DuPont Analysis provides an excellent tool for identifying higher-quality securities, products and model portfolios.
1 See the Modigliani-Miller Theorem: Https://www.investopedia.com/terms/m/modigliani-millertheorem.asp.
Share & Comment
Popular Posts
Categories
Related Links