
Everyone Talks about “Quality” Funds, but What Does That Even Mean?


Our industry likes to toss around terms that strike different thoughts in different people.
Just look at the “growth” and “value” investing styles. What are we growing these days? Earnings? Revenues? The customer base?
For valuations, some may want low P/E ratios, others high dividend yields, while maybe the “right” answer is some combination—or different measures altogether.
As it applies to stocks, what does that word mean? To boil it down: a smart beta quality screen is for investors who want highly profitable companies that manage to pull it off without a mountain of debt.
The oft-cited profitability metric is return on equity (ROE), while the debt part is sometimes found by checking how the company stacks up in the context of return on assets (ROA). If ROA is low and ROE is high, we know how the firm achieves it: management gooses the balance sheet with debt. You can minimize the goosing by explicitly incorporating ROA into a smart beta screen, which is something we do in a bunch of our Funds.
Figure 1: Definition of Quality, by Index Provider
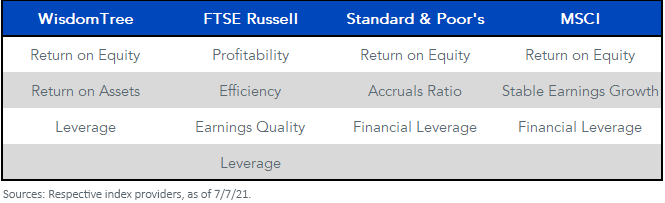
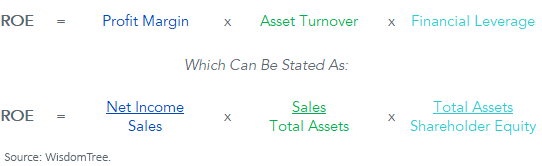
The intellectual framework for ROE is intuitive. Look for three things: business strength, stability and operational efficiency. Each is in the DuPont equation, which shows how quality—or ROE—is simply the interaction between profit margins, business efficiency and balance sheet risk (figure 2).
Ideally, achieving high ROE with low leverage is the way to go.
Figure 2: DuPont Equation for ROE
The problem: while this is great in theory, quality strategies have been disappointing in recent market declines. Take a look at what happened in five of the last nine swoons in the S&P 500 (figure 3).
Figure 3: Quality Stocks’ Struggles
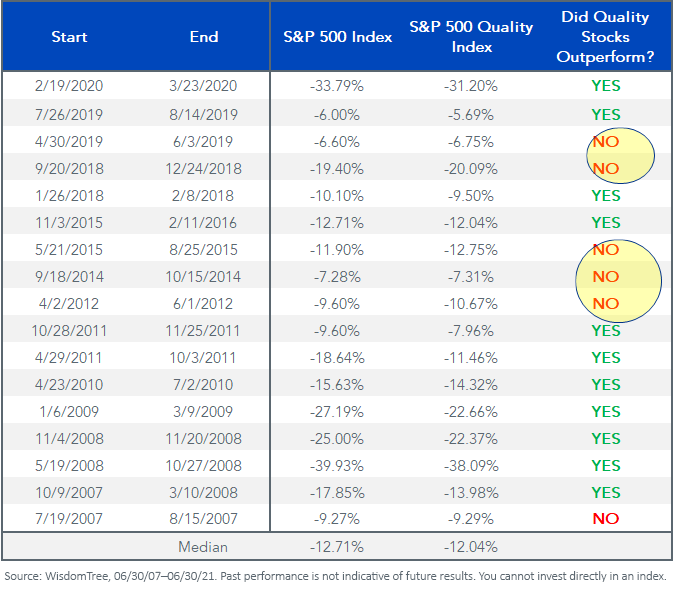
For definitions of terms in the table, please visit the glossary.
Not only that, but quality has been lagging in this 15+ month market moon shoot. Sure, you could have bigger problems in life than watching the S&P 500 Quality index go up “only” 95.6% since March 23, 2020. Nevertheless, that is 4 percentage points short of the 99.7% run in the S&P 500 off the COVID-19 lows.
It’s showing up in valuations. According to Bank of America’s quant team, we have not seen high quality stocks this cheap relative to low quality peers in over a decade (figure 4).
Figure 4: High Quality (B+ or better) S&P Quality Ranks vs. Low Quality (B or worse) Fwd. P/E Relative to BofA Universe (1986–5/31/21)
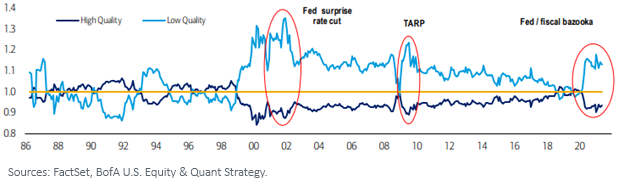
Though low quality has been running higher as the COVID-19-inspired economic depression transitioned to early recovery, one of these days we will enter the middle of the economic cycle—if that stage is not already here. The impulse to buy anything and everything, with little regard for operational efficiency, should seemingly fade as the clock ticks. That environment would enable quality concepts to claw out of this tunnel of frustration.
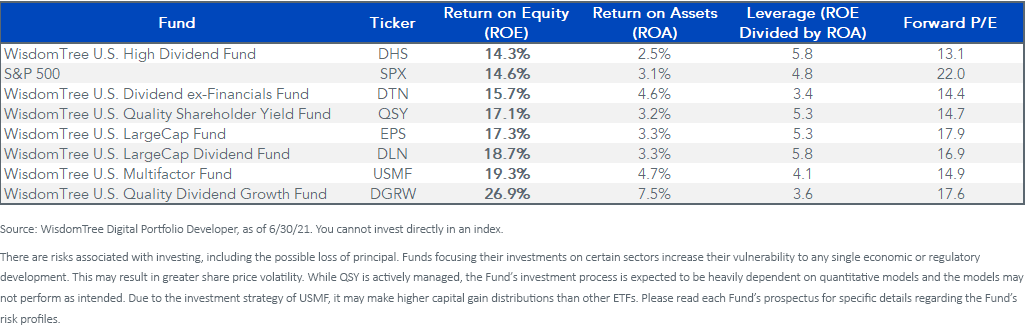
Here is a sample of our U.S. equity mandates, sorted by ROE. Many of them are clocking in higher than the S&P, with lower P/E ratios. Use this as a hunting ground for upping portfolio quality metrics.
Figure 5: Quality Spectrum
Share & Comment
Popular Posts
Categories
Related Links