
Stock Buybacks Can Battle the Bear


The true investment challenge is to perform well in difficult times.
–Seth Klarman
Navigating 2022 has been an exercise in managing volatility.
On top of ugly market action late last year, the pain has continued in this year’s first two months. Anything with a whiff of speculative flavor has a target on its back. While the NASDAQ Composite Index is off 14.8% YTD, and the S&P 500 has fallen 8.9%, our buyback-focused concept—the WisdomTree U.S. Value Fund (WTV)—has only given back 4.4% at NAV.
Figure 1: Year-to-Date Returns
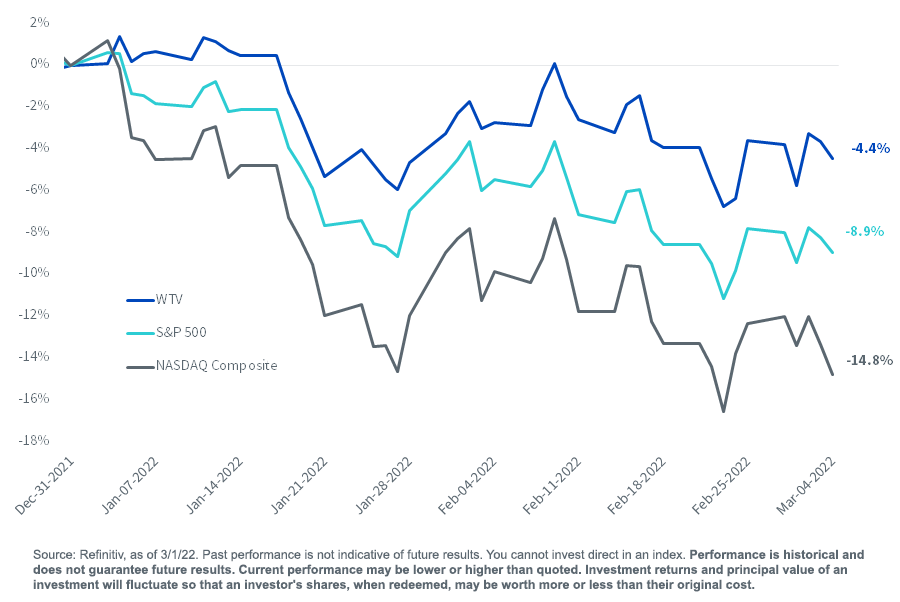
For the most recent month-end and standardized performance click here.
That isn’t surprising. The six major bear markets of the last half-century devastated companies that were heavy equity issuers, the kinds of stocks WTV's buyback screen tends to avoid. In crashes, the diluters plunged. While “nobody makes money in a bear market,” owners of the “buybackers” lived to see another day.
Figure 2: Three-Year Cumulative Return by Share Issuance
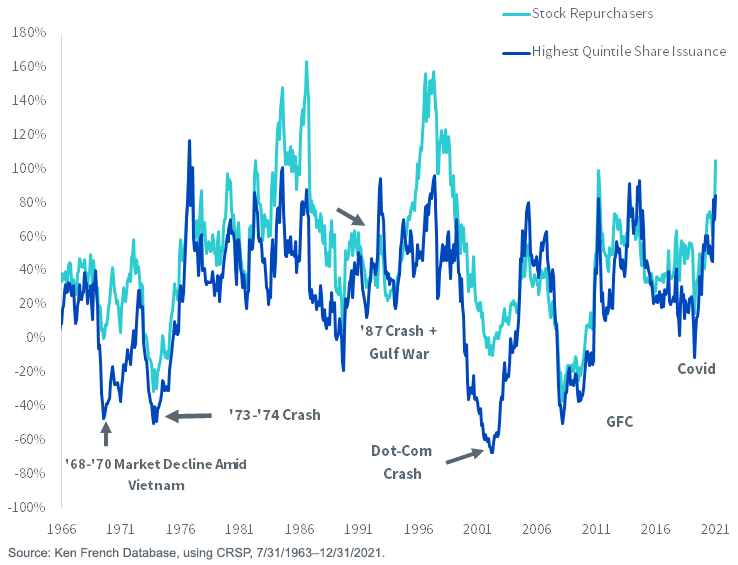
For example, look at the 1968–1970 bear market. The heaviest shareholder diluters were halved. Then they caught a three-year rally, only to be halved again in the 1973–1974 bear market.
Or the dot-com wreck. The big diluters declined by two-thirds over three years. In all three of those bear markets—and in the others—the stock repurchasers remained standing.
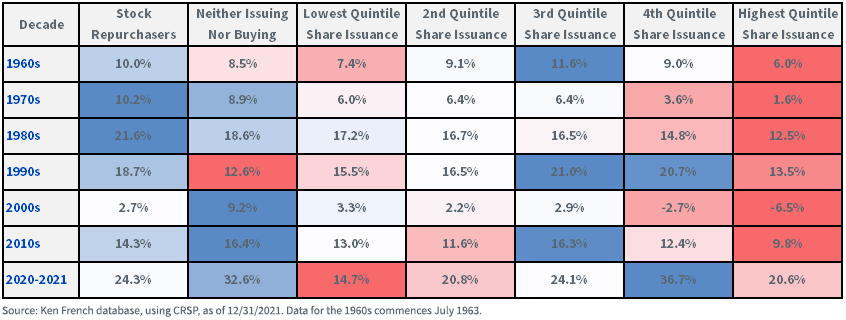
The red-and-blue color scheme of figure 3 speaks for itself.
Figure 3: Stock Market Returns, 1963–2021, Ranked by Share Buybacks vs. Share Issuance
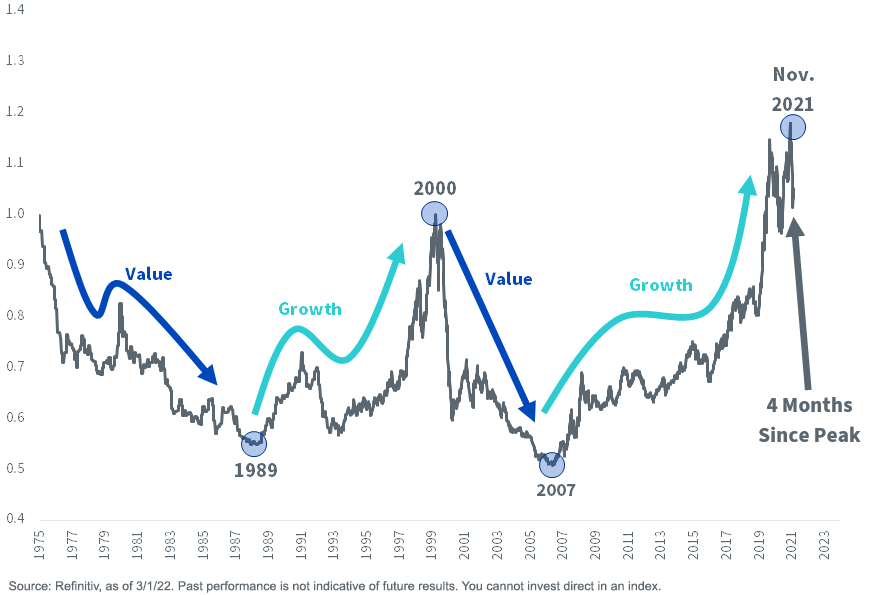
I’m thinking maybe we are in the first inning of a multiyear value cycle (figure 4). If I am right, the diluters are to be avoided.
Figure 4: S&P 500 Growth Relative to S&P 500 Value
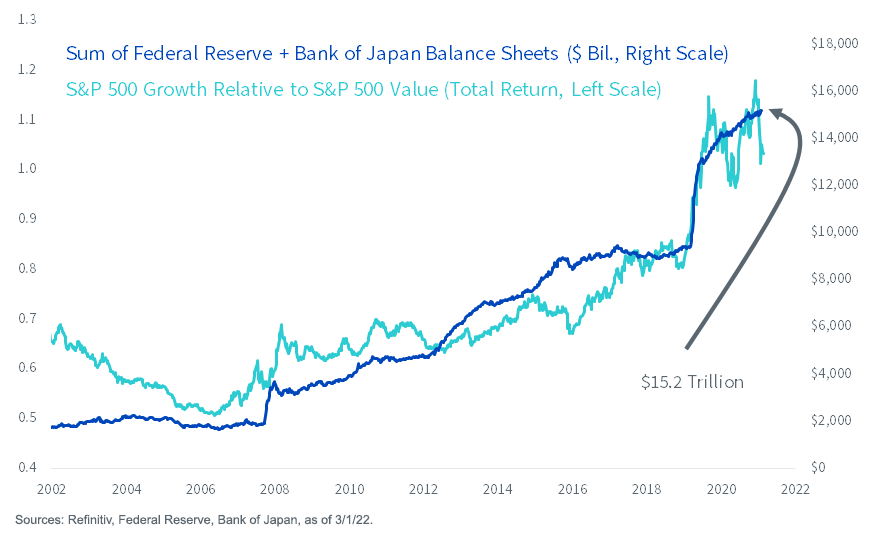
Many market watchers, including myself, suspect figure 5 explains growth versus value since the global financial crisis. So long as the Fed and other central banks were expanding their balance sheets to maintain zero interest rates, the present value math on growth stocks’ distant cash flows could justify big valuations (figure 5). A few months ago, when investors came to realize the monetary regime was set to flip, the tables turned.
Figure 5: Growth vs. Value: Dependent on Central Banks’ Bond Purchases
We recently cut WTV's expense ratio to 0.12%.
It has a net buyback yield of 5.6%, which is akin to a $10 billion market cap company buying back $560 million worth of stock in a year. That is four times as high as the S&P 500’s net buyback yield of 1.4%.
WTV has annually beaten both the S&P 500 Value and the Russell 1000 Value Indexes by more than a percentage point since its inception a generation ago through March 7, 2022. It has zero exposure to share diluters.
Important Risks Related to this Article
There are risks associated with investing, including possible loss of principal. Funds focusing their investments on certain sectors increase their vulnerability to any single economic or regulatory development. This may result in greater share price volatility. While the Fund is actively managed, the Fund’s investment process is expected to be heavily dependent on quantitative models, and the models may not perform as intended. Please read the Fund’s prospectus for specific details regarding the Fund’s risk profile.
Share & Comment
Popular Posts
Categories
Related Links