
A Turning Point for Emerging Markets


Positive developments for vaccines offer hope for the ultimate reopening of the global economy in 2021 and are causing many to look for the much-awaited “rotation” into value strategies. In one example of this value rotation, emerging market equities have outperformed the U.S. by more than 600 basis points (bps) since early September.
By a number of measures, WisdomTree’s lowest-valuation and most value-leaning Indexes can be found in emerging markets.
At the end of October, WisdomTree conducted the annual rebalance for its dividend-weighted emerging markets Indexes.
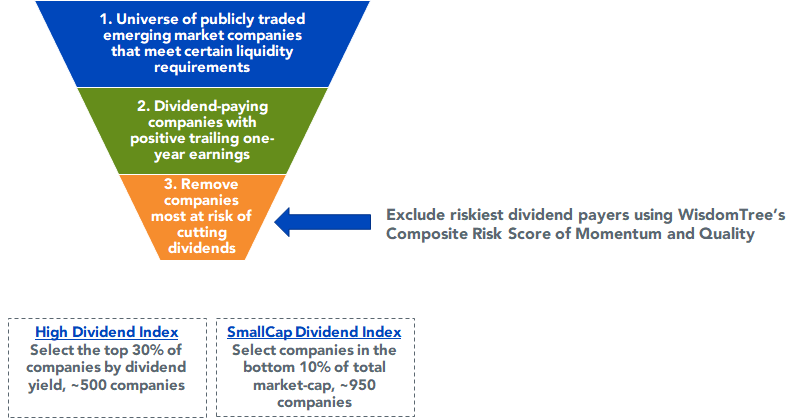
Let’s review the methodologies for two of these Indexes—the WisdomTree Emerging Markets High Dividend Index and the WisdomTree Emerging Markets SmallCap Dividend Index.
The first two steps—selecting a liquid universe of companies and filtering for dividend payers with positive trailing earnings—is unchanged from last year’s reconstitution.
New to these Indexes this year is an enhanced risk screen to remove the riskiest dividend payers from the starting universe.
This additional screen adds a quality tilt to the value factor and mitigates exposure to companies most likely to cut or suspend their dividends, which tend to lag the market.
WisdomTree Emerging Markets Dividend Indexes
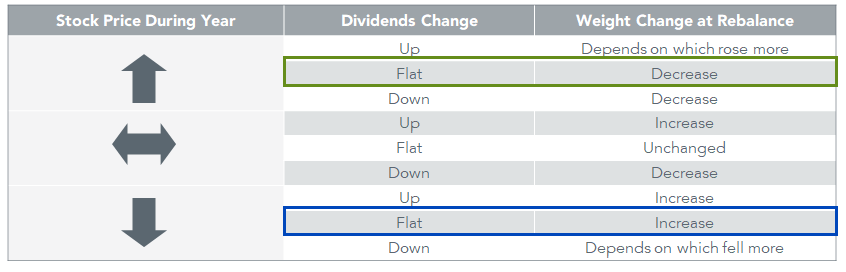
After selecting constituents, holdings are initially Dividend Stream® weighted by cash dividends paid. Subsequently, the companies with the highest composite risk scores (top two deciles) have their Dividend Stream weights increased by 1.5x. This increase reflects greater conviction in higher-scoring companies’ ability to maintain or increase dividends.
The byproduct of Dividend Stream weighting is a tendency to “sell your winners and buy your losers.”
The table below shows a simplified example of changes to a company’s dividend and stock price during the year and whether weight is increased or decreased to that company at rebalance.
If we look at the green box, a flat (or unchanged) dividend accompanied by an increase in stock price during the year would likely see a decrease in weight (selling).
For the scenario in the blue box, a company that was down during the year but had a flat dividend would likely have weight increased (buying).
If we made the simplified (but inaccurate) assumption that dividends today were roughly in line with last October’s rebalance, we would expect the Index to increase weight to the sectors that lagged and reduce weight to those that outperformed.
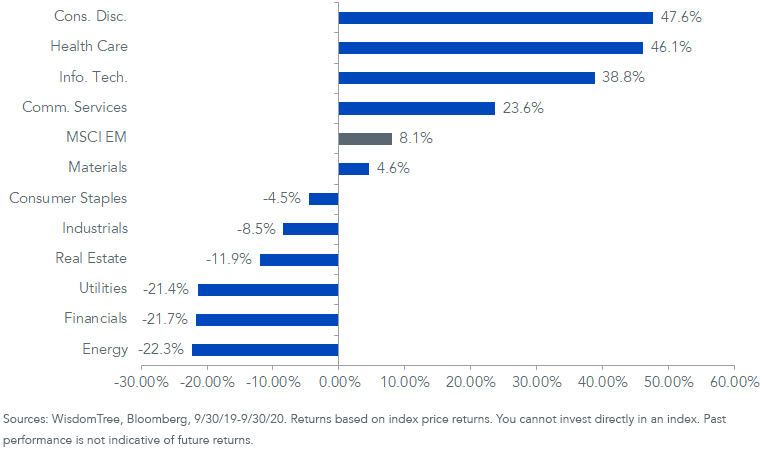
When we look at the 12-month performance of EM equities between Index screening dates, that would mean trimming exposure to the outperforming growth sectors and adding exposure to lagging value sectors.
MSCI Emerging Markets Index
Sector and Country Changes
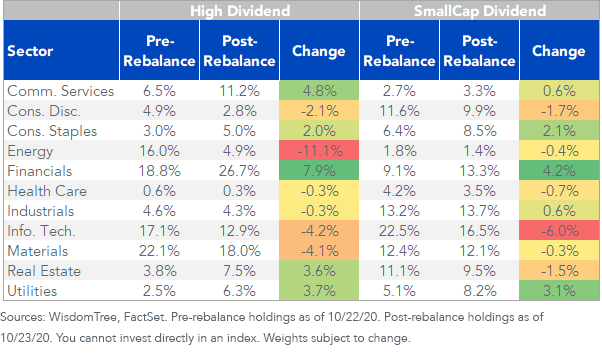
Between the two Indexes, there are a handful of notable sector weight changes from the rebalance.
- High Dividend Index reduced Energy exposure by 11% – Energy was the worst-performing EM sector over the past 12 months. It was also a sector that had significant dividend reductions, as energy companies were squeezed by dropping oil prices. Because many EM energy companies target dividend payments around payout ratios (paying a percentage of last year’s earnings), we will likely see more dividend cuts to come from EM energy companies in 2021 as a result of depressed 2020 earnings.
- Both Indexes added exposure to Financials – Financials was the second-worst performing sector but did better with maintaining dividends and didn’t have as significant a drop in earnings.
- Outperforming Tech sector exposure trimmed in both Indexes – Tech was one of the best-performing EM sectors, so the rebalance process of selling winners results in reduced weight.
WisdomTree Emerging Markets Dividend Indexes
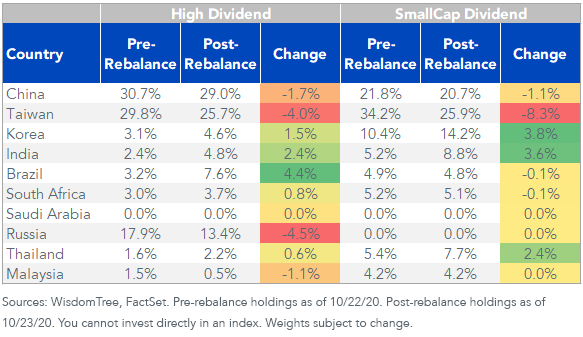
Country-level changes were more modest than with sectors. Each Index’s rule around 25% country caps drove reduced weights to Taiwan in both Indexes. Because there is a rule for an additional 5% weight to China domestically listed A-shares, the China cap is effectively 30%.
WisdomTree Emerging Markets Dividend Indexes
Factor Tilts and Fundamentals
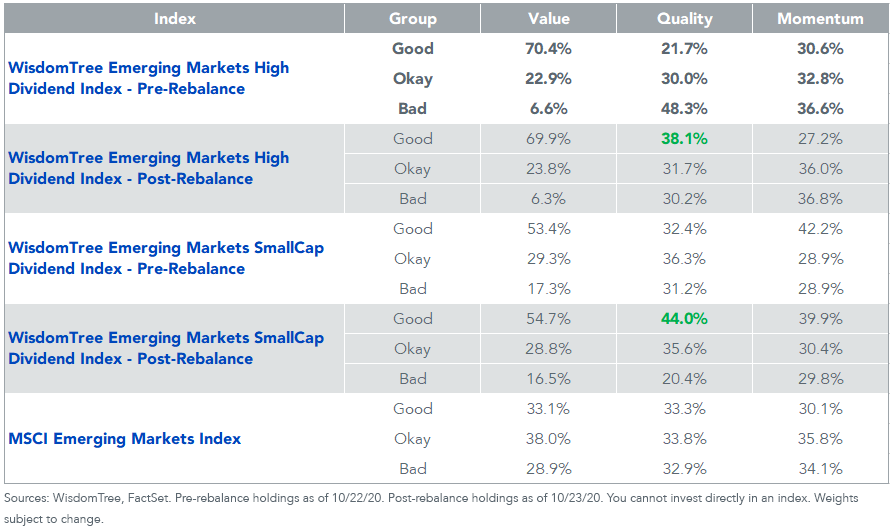
After the rebalance, there is a significant pickup in quality factor exposures for both Indexes from removing the riskiest dividend payers.
In our factor-exposure scorecard below, each category—"Good,” “Okay” and “Bad”—contains roughly a third of the total market cap of emerging market equities. Tilts away from the market across these categories indicate how an Index taps into these different factors.
What’s notable is that each Index significantly increased quality exposure without sacrificing its distinct value tilts (each has significantly greater than 33% of its weight in “Good” value).
Factor Exposures
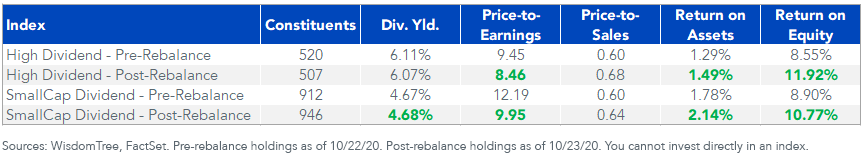
These factor tilts are confirmed by what we see in the Index characteristic pre- and post-rebalance. Both Indexes have roughly the same dividend yield, a lower price-to-earnings ratio and a slightly higher price-to-sales ratio. And each Index has significantly better profitability metrics.
WisdomTree Emerging Markets Dividend Index Characteristics
Reducing “Home Country Bias”
We understand many investors may have significant “home country bias” reflected in their portfolios as a byproduct of years of U.S. outperformance. While it’s impossible to time turning points for when international equities may outperform, perhaps a more trade-friendly White House and a global economic recovery in the years to come may make that turning point arrive sooner rather than later.
Share & Comment
Popular Posts
Categories
Related Links