
19th Nervous Breakdown


The coronavirus fears continue to impact the fixed income markets. Here’s our latest update.
Looking at the U.S. Treasury (UST) market’s reaction to the coronavirus news, there was one by-product we knew would capture the lion’s share of the headlines: THE YIELD CURVE INVERTS AGAIN! Once the UST 3-month/10-year spread went negative about two weeks ago, one almost knew there would be a 19th nervous breakdown of sorts. So, let’s take a deep breath and examine this most recent bout into negativity.
Treasury Yield Curve
Why did the Rolling Stones’ classic song come to mind? Easy, just remembering the headlines that were screaming “a recession is inevitable” as recently as late spring/early summer of last year, when this spread first went into inverted territory. I’m a student of history, so there is no question I respected the inverted curve’s prior predictive value. However, I also acknowledged back then that, due to a variety of factors, this time could be different.
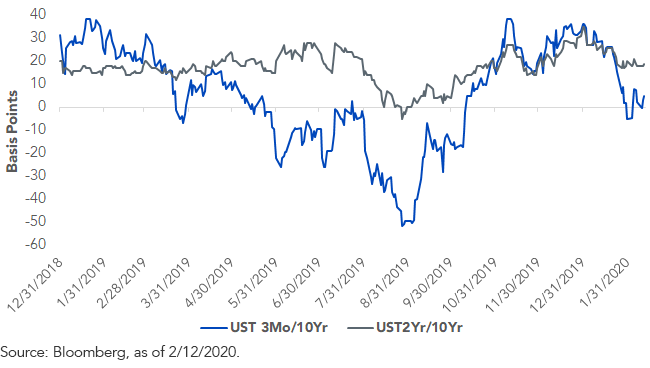
That was then, this is now! All the focus has been on the aforementioned 3-month/10-year curve, but my preference lies with the UST 2-year/10-year curve. Let’s compare and contrast (look at the graph!).
- At one point, the UST 3-month/10-year narrowed by roughly 35 basis points (bps) since the virus news broke, posting its first negative reading (-5 bps) on Jan 31—it’s back in positive territory (+5 bps) as of this writing
- The UST 2-year/10-year curve has been far more stable, declining a more modest 6 bps during the same period, remaining just under +20 bps
Conclusion
As was the case during last year’s inverted episode, I don’t believe this development is a harbinger of a recession either. The negative 3-month/10-year spread this time around is purely a reflection of the coronavirus safe-haven bid into Treasuries, with the 10-year note being the beneficiary in this case. Interestingly, the 2s/10s differential remains in positive territory, and as the graph clearly illustrates, there has been a rather visible disconnect between these two curve relationships thus far in 2020. Another factor not to be overlooked is the recent development in the High Yield (HY) and Investment Grade (IG) corporate bond markets. After widening by 75 bps, HY spreads have now retraced almost 60% of this increase, and in the case of IG corporates, the spread was actually 1 bp below the pre-coronavirus level, as of this writing.
What does all of this mean? Whisper words of wisdom and let it be…
Unless otherwise stated, data source is Bloomberg, as of February 12, 2020.
Share & Comment
Popular Posts
Categories
Related Links