
High-Dividend Stocks: Calling March 6, 2009


It’s not often that you come across a chart that rivals levels last seen on the day the stock market bottomed out during the global financial crisis—ancient history now. March 6, 2009 witnessed the S&P 500 touch an intraday generational low of 666 (it is around 2,900 now).
That day also marked the beginning of the end for growth stocks for 49 months. From the stock market bottom to 4/18/2013, the WisdomTree U.S. High Dividend Index outperformed the S&P 500 Growth Index by 1,063 basis points (bps) annually. The fun for deep value mandates ended right then and there, followed by over six years of frustration to this day.
But as you can see, things are getting…interesting.
Figure 1: U.S. Growth Stocks Relative to High-Dividend Stocks
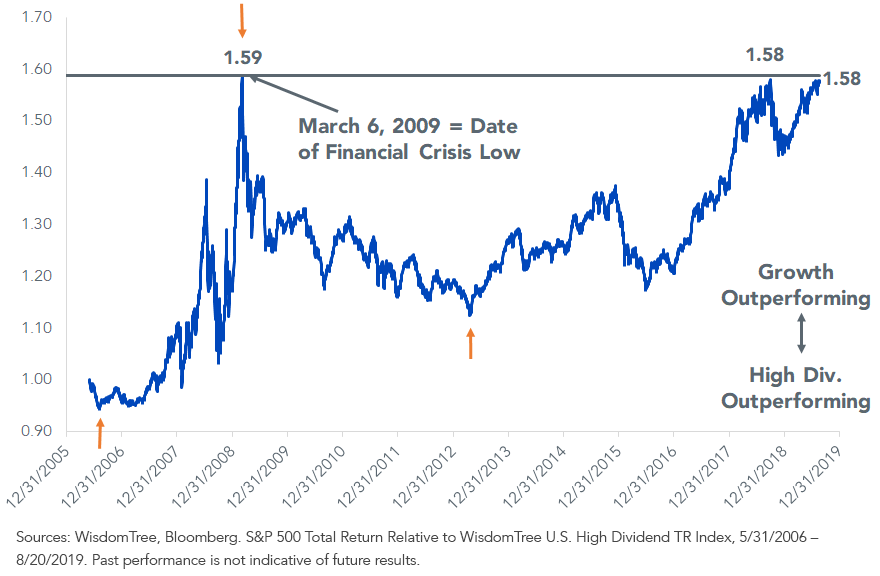
In the chart above, I marked the big turning points with orange arrows. Figures 2–4 show the returns between them.
Figure 2: Index Returns, 8/4/2006 (1st Orange Arrow) through 3/9/2009 (2nd Orange Arrow)
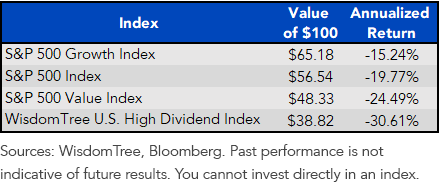
Figure 3: Index Returns, 3/9/2009 (2nd Orange Arrow) through 4/18/2013 (3rd Orange Arrow)
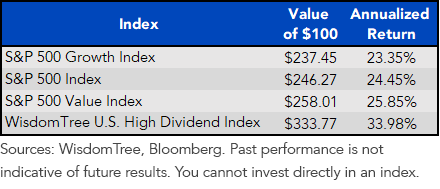
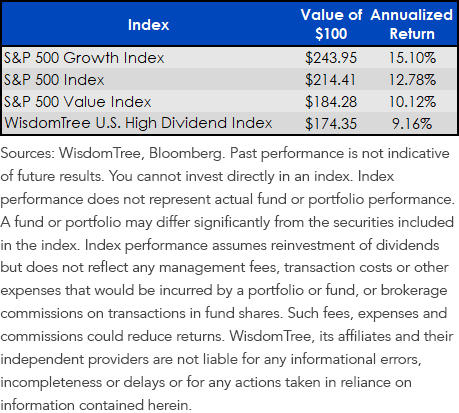
Figure 4: Index Returns, 4/18/2013 (3rd Orange Arrow) through Present (8/20/2019)
Because high-dividend companies comprise the value stocks of value stocks, notice that our Index did particularly poorly when value was “off?” Likewise, when value came snapping back in 2009, WisdomTree’s Index ripped higher, beating the S&P 500 by nearly double digits annually for years on end.
When deep value is on, deep value is on.
It has been forever since hunting for big dividends has paid off, so I can’t say if this is just the kind of extreme needed to cause a change in market leadership. But I will tell you this: Respect any chart that is near or touching March 6, 2009 levels.
Unless otherwise stated all data is from Bloomberg, as of 8/20/2019.
Share & Comment
Popular Posts
Categories
Related Links