Are Factors Losing Their Edge?


I’ve recently read several articles from a variety of sources that caught my eye. The common thread of these articles was that return factors—those that have shown a propensity to outperform the market over time—have been losing their ability to outperform.
Most of these articles posit that as factors have gained in prominence in financial circles, the potential for future outperformance has been arbitraged away. Since so much money has been funneled into smart beta exchange-traded funds (ETFs) aimed at exploiting these exact factors, less of an edge will exist going forward. A bold claim, to be sure, but does the data back it up?
Using data from Professor Kenneth French’s website, we can isolate several U.S. equity factors and compare them to the market’s returns. We took the four most oft-cited factors—size, value, quality and momentum—and analyzed them over rolling 10-year periods to view the effectiveness of these factors over the entirety of market cycles. Has there been a drop-off in performance in recent years?
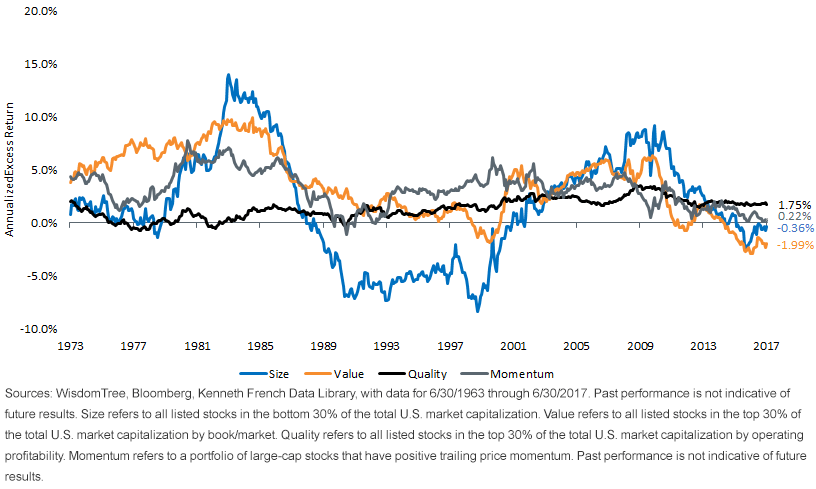
Rolling 10-Year Annualized Excess Return vs. S&P 500

Reduced Outperformance, but Not Eliminated Outperformance
Looking at the data, a few takeaways emerge:
- It does appear that starting in 2011, the excess return for all four factors versus the S&P 500 has been coming down, to varying degrees.
- The last decade for the size factor, which can see its relative performance ebb and flow over long stretches of time, is one of the worst periods of relative performance since the tech bubble of the late 1990s.
- Value is in the midst of its worst stretch of relative performance in history.
- Momentum and quality have remained consistent outperformers, with quality of note for its stability of excess returns. In fact, there has not been a rolling 10-year period where quality didn’t outperform the S&P 500 since 1990, with all annualized excess returns between .25% and 3.55%.
Admittedly, the last few years have seen somewhat of a reduced level of outperformance from these four factors—but certainly not an elimination of outperformance. However, this is not the first time that this has happened, as a similar trend took hold from 1986 to 1990. Further, it certainly looks that there are strong elements of cyclicality in size and value, with both factors currently at or near multidecade lows.
Don’t Forget About Risk
Although outperformance is the goal, one important element that the previous analysis and many others don’t consider is the amount of risk taken to achieve that excess performance. If we perform a similar analysis using risk-adjusted returns with the rolling Sharpe ratio of each factor and compare it to that of the S&P 500, we can see which factors have provided a superior return experience for investors.
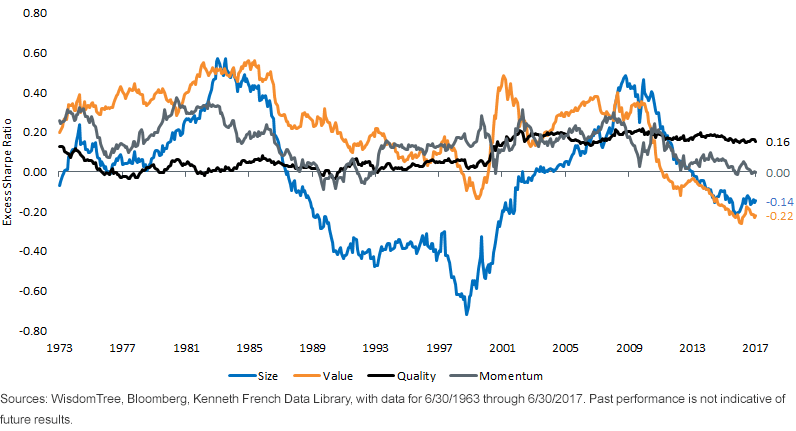
Rolling 10-Year Excess Sharpe Ratio vs. S&P 500

Again we see that size and value go through relatively more volatile periods of superior risk-adjusted performances, with greater consistency from quality and momentum (the latter two factors had higher Sharpe ratios than the S&P 500 90% and 93% of the time, respectively).
One key difference between the two charts is that unlike the other three factors, quality is the only factor to have seen stability in its excess risk-adjusted returns over the last six years. In fact, the value-additive ability of the quality factor appears to have gradually increased from the early 1990s to today. While the S&P 500 has been a very difficult bogey to beat over the last decade, the quality factor has displayed remarkable consistency in its outperformance on an absolute and risk-adjusted basis, over significantly longer time frames than just the last 10 years.
Ramifications for Portfolio Construction
From a portfolio construction context, what does this tell us?
- If an investor was forced to pick only one factor in which he or she was exposed to over the long term, quality would likely be the preferred choice. Intuitively speaking, this makes sense: it is rarely a bad idea to construct a portfolio with quality companies at the core and building out from there.
- Diversification across multiple factors, just like in all other parts of an investor’s portfolio, is ideal. Factors go in and out of favor, and having exposure to more than one can lead to more favorable portfolio outcomes. WisdomTree has found over its history that a multifactor outcome can be organically attained through a single-factor input such as dividends or earnings, and recently we’ve launched a strategy that has a dedicated exposure to each of these factors simultaneously.
- There are many ways to gain exposure to these factors. Each of these factors may have a different definition for any given investor as well as a preferred vehicle in which they access it. We’ve been helping our clients understand what their portfolio factor exposures look like and consulting how to implement different strategies to achieve a more desired outcome.
- This analysis only covers U.S. equity markets, which are arguably the most efficient public equity markets in the world. The adoption of smart beta and factor strategies has been much slower in international developed and emerging markets, implying that the opportunities to outperform with a factor-based approach may still be aplenty.
In later posts, I will show how investors can utilize strategies to capture the quality factor in their portfolios and analyze the efficacy of return factors in international markets.


