How We Tap into Three Key Smart Beta Factors with EZM and EES


Sometimes numbers are worth a thousand words.
For example, these percentages: 99% and 92%. In school, a score of 90% or better on an exam is equated with excellence.
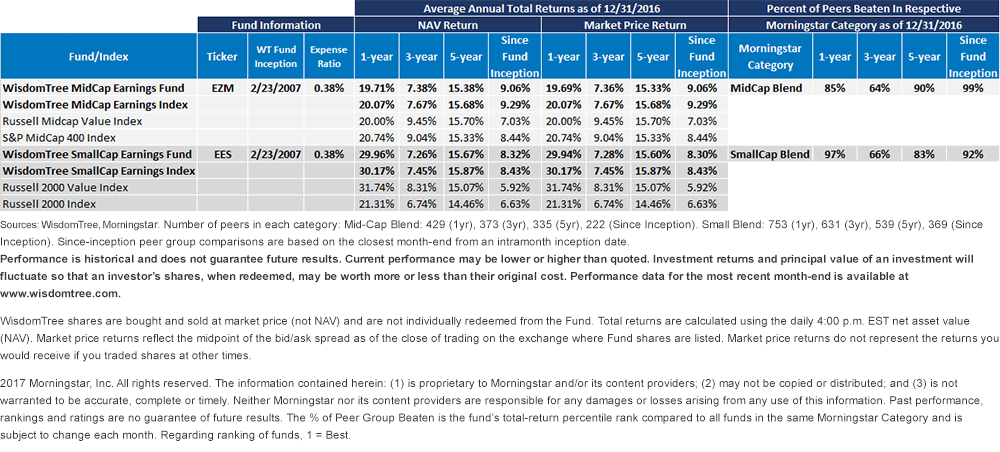
In asset management, these percentages make it easy to compare how a particular fund has performed against competitor funds in a defined category over a specific time frame. In the case of the WisdomTree MidCap Earnings Fund (EZM), 99% corresponds to the percentage of funds in its peer group that EZM outperformed over nearly 10 years, according to Morningstar; 92% is the corresponding figure for the percentage of mutual funds and exchange-traded funds (ETFs) that the WisdomTree SmallCap Earnings Fund (EES) outperformed in its peer group over nearly 10 years.
How is that possible? How can an index fund, an ETF, beat the vast majority of active and passive competitors in its category? Aren’t index funds supposed to be average?
Well, if it’s a WisdomTree ETF tracking a WisdomTree Index, it’s not uncommon to see above-average results.
As we can see from the table below, after fees, expenses and transaction costs, EES and EZM outperformed both the core and value cuts of major capitalization-weighted indexes since their respective inceptions back in 2007. And if an ETF can beat the major benchmarks over time, the odds are high that it will also beat the vast majority of active managers.

The truth is, in many instances, index funds over time have generated above-average returns compared to active managers, after accounting for fees, expenses and transaction costs. That realization has contributed to a great migration in assets that has been occurring over the past several years—out of equity mutual funds and into equity ETFs.
How WisdomTree Taps into Multiple Factors
How do we explain WisdomTree’s success in generating returns that have beaten active and passive competition for nearly a decade? Let’s start by examining some ways the earnings-weighted Indexes that EZM and EES seek to track tap into the value, quality and size factors that have been associated with excess returns compared to the broader market over time.
•Value: The WisdomTree MidCap Earnings and WisdomTree SmallCap Earnings Indexes tap into the value factor through their earnings-weighted methodology and annual rebalancing process. Each December, the indexes rebalance to include only profitable companies and then weight those companies based on the profits they generated in the prior year. This selection and weighting process typically lowers the aggregate price-to-earnings (P/E) ratio, a measure of value, relative to comparable market cap-weighted indexes.
•Quality: We also find that weighting profitable companies by earnings tends to tilt our Indexes toward stocks with higher measures of return on equity (ROE) and return on assets (ROA), commonly used measures of the quality (or profitability) factor.
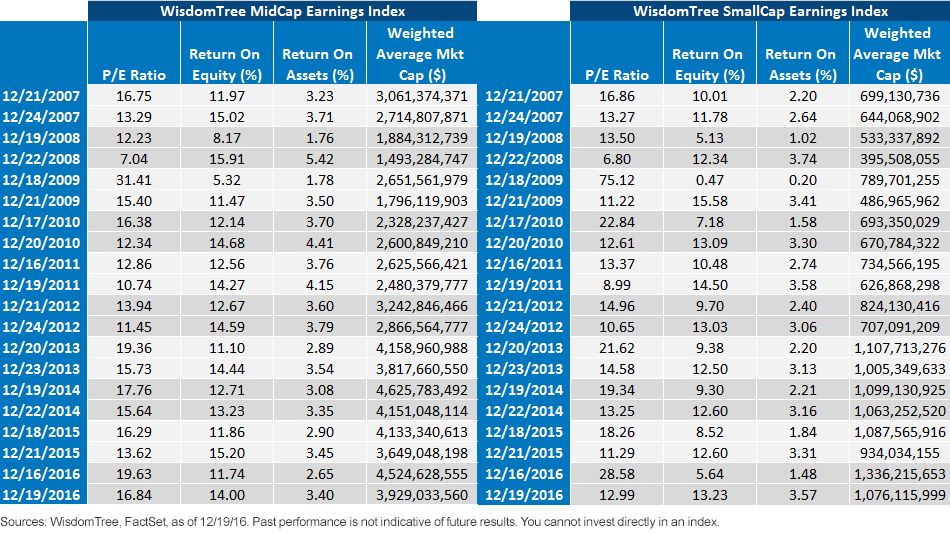
•Size: Providing purer exposure to the mid- and small-cap segments of the market can also help improve returns over time. As of December 31, 2016, the WisdomTree MidCap Earnings Index held 95% of its weight in stocks between the $2 billion and $10 billion market cap range, while the WisdomTree SmallCap Earnings Index held 100% of its weight in stocks with market values below $2 billion. These percentages, along with the weighted average market capitalizations of these two WisdomTree Indexes, show just how efficiently they capture targeted size factor exposure.
WisdomTree Replenishes These Smart Beta Factor Exposures at the Annual Rebalance
In the two tables below, we show summary statistics for the Indexes that EZM and EES track: the WisdomTree MidCap Earnings Index and the WisdomTree SmallCap Earnings Index, respectively. Note that in each and every case, at the annual rebalance going back to 2007, WisdomTree was able to lower the P/E ratio of each Index, while raising aggregate return on equity and return on assets compared to where they were before the rebalance.

By rebalancing, each Index increased its exposure to proxies for value and quality 100% of the time. Ninety-nine percent of the time, these Indexes increased their exposure to all three return premiums, including size. In other words, both Indexes not only provide exposure to these three smart beta factors in a passive rules-based structure, they have also successfully refreshed and increased these exposures, once per year, via WisdomTree’s annual rebalance process.
Conclusion: Explore the Core
Because EZM and EES track broad, representative Indexes, they can be used by investors seeking to generate passive alpha in the core of their portfolios. Since their respective inceptions in February 2007, EZM has beaten 99% of the funds it its peer group; EES has outperformed 92%. Having beaten both beta benchmarks and the vast majority of active managers over the past decade, these two WisdomTree ETFs rank among WisdomTree’s most compelling “smart beta” offerings.
Important Risks Related to this Article
There are risks associated with investing, including possible loss of principal. Funds focusing their investments on certain sectors and/or smaller companies increase their vulnerability to any single economic or regulatory development. This may result in greater share price volatility. Please read the Fund’s prospectus for specific details regarding the Fund’s risk profile.


