Growth Beats Value, but Dividends Outperform


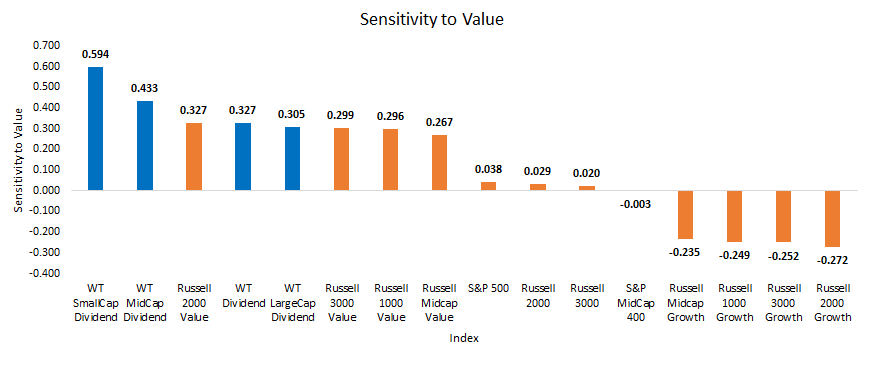
 • Dividend Strategies Tilt toward Value: This point is congruent with intuition, as in the United States equity markets many growth companies—especially in mid- and small caps—do not pay regular cash dividends. The WisdomTree SmallCap and MidCap Dividend Indexes were clearly two of the strategies most heavily tilted toward value over this period.
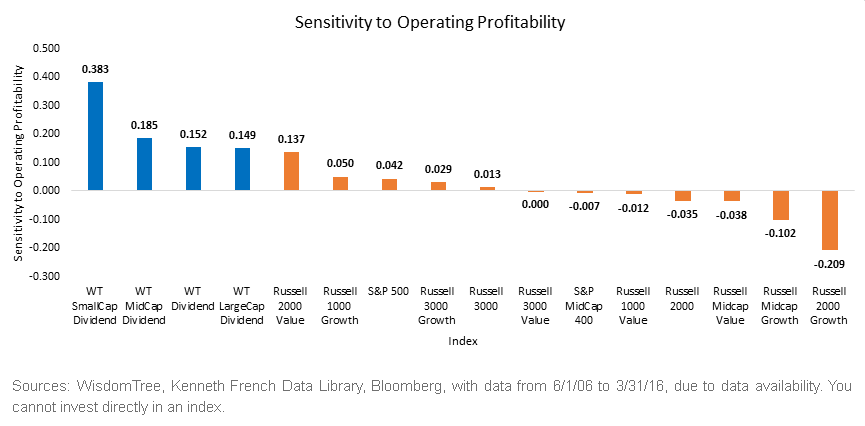
• Dividend Strategies Tilt toward Operating Profitability: What’s more interesting is that over the same period, the WisdomTree Dividend Indexes shown all tilted more toward operating profitability than all of the other market capitalization-weighted benchmarks shown. This is a remarkable result, in our opinion, in that it clearly shows that, over this period, focusing on dividends and rebalancing back toward the Dividend Stream® in a disciplined manner did more than simply capture sensitivity to value.
Our Dividend Strategies Captured More Than Just Value Sensitivity
We wrote in a prior blog post that “value” was not a great tilt to have over the most recent rolling 10-year period, delivering some of its worst performance seen compared to stocks tilted in the opposite direction, having much lower book-to-market value ratios. Knowing that, it makes the live performance record of the WisdomTree strategies all the more remarkable for these first 10 years of history.
1Eugene F. Fama & Kenneth R. French, “The Cross-Section of Expected Stock Returns,” The Journal of Finance, Volume XLVII, No. 2, June 1992.

Christopher Gannatti began at WisdomTree as a Research Analyst in December 2010, working directly with Jeremy Schwartz, CFA®, Director of Research. In January of 2014, he was promoted to Associate Director of Research where he was responsible to lead different groups of analysts and strategists within the broader Research team at WisdomTree. In February of 2018, Christopher was promoted to Head of Research, Europe, where he was based out of WisdomTree’s London office and was responsible for the full WisdomTree research effort within the European market, as well as supporting the UCITs platform globally. In November 2021, Christopher was promoted to Global Head of Research, now responsible for numerous communications on investment strategy globally, particularly in the thematic equity space. Christopher came to WisdomTree from Lord Abbett, where he worked for four and a half years as a Regional Consultant. He received his MBA in Quantitative Finance, Accounting, and Economics from NYU’s Stern School of Business in 2010, and he received his bachelor’s degree from Colgate University in Economics in 2006. Christopher is a holder of the Chartered Financial Analyst Designation.

