How to Experience a 35-Year Record High in Japan

05/02/2024

Key Takeaways

  • Japan's equity market reached a 35-year record high in the first quarter of 2024, driven by the weakness of the yen against the U.S. dollar. 
  • The WisdomTree Japan Hedged Equity Fund (DXJ) and the iShares Currency Hedged MSCI Japan ETF (HEWJ) delivered compelling performance after the Covid-19 market correction, even when measured against the Russell 1000 Growth Index. 
  • For those bullish on Japan's equities, consider hedging the risk of movements in the yen/U.S. dollar exchange rate.
 

Who was predicting that, during the first quarter of 2024, we would see record highs in:

  • The price of one bitcoin1
  • The price of one ounce of gold2

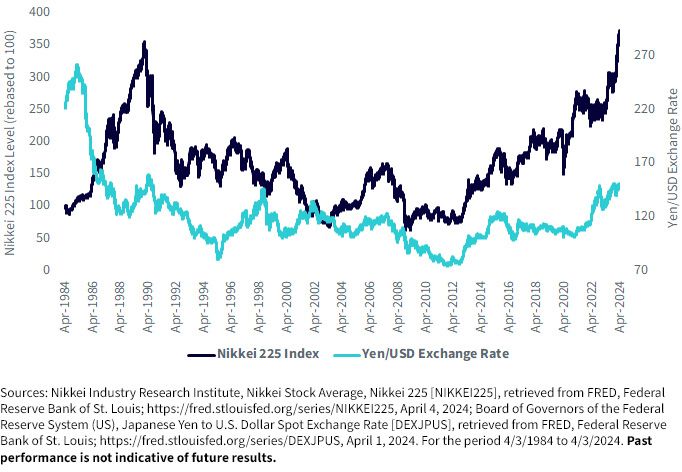
Out of those, I have to admit I was most excited about Japan’s equity market, as this new record high took from 1989 (roughly 35 years) to surpass. At WisdomTree, we were heavily focused on Japan when Prime Minister Shinzo Abe was first elected in 20124, but it was not viewed as remotely reasonable to even consider that a surge in the equity market could take us back to 1989 levels at that point.

Figure 1 looks at the last 40 years:

  • We see the initial high in the Nikkei 225 Index in 1989 and then how it took until the first quarter of 2024 to come back to these levels—a period of about 35 years.
  • It’s important to also review the level of the yen—we see that it approached 270 to 1 USD back in the mid-1980’s before strengthening all the way down to roughly 75 to 1 USD around the time of Prime Minister Abe’s election. Back in 2012 through 2015, we were writing a lot about the yen’s weakening trend—it got all the way to 126 to 1 USD—but it took until the COVID-19 period to truly break beyond 130.

Bottom line: To us, it is not an accident that Japan’s equity market is breaking out to new highs after a period of significant yen weakness against the U.S. dollar.

Figure 1: 40 Years of History of the Nikkei 225 Index and the Yen/USD Exchange Rate

40 Years of History for the Nikkei 225 Index and the Yen/USD Exchange Rate graph

Drawing Out Critical Points with Different Exchange Traded Fund Strategies

A beautiful thing about the proliferation of ETFs is that we can use more and more strategies to illustrate different stories playing out across asset classes in markets. Here, we can look at some of the most widely followed strategies that provide exposure to Japanese equities:5

  • WisdomTree Japan Hedged Equity Fund (DXJ): The WisdomTree Japan Hedged Equity Fund is designed to, track the total return performance, before fees and expenses, of the WisdomTree Japan Hedged Equity Index. The Index consists of dividend-paying companies incorporated in Japan and traded on the Tokyo Stock Exchange that derive less than 80% of their revenue from sources in Japan, tilting toward companies with a more global revenue base. The Index also hedges exposure to fluctuations in the exchange rate between the Japanese yen and the U.S. dollar.
  • iShares Currency Hedged MSCI Japan ETF (HEWJ): The iShares Currency Hedged MSCI Japan ETF is designed to track the total return performance, before fees and expenses, of the MSCI Japan 100% Hedged to USD Index. This Index hedges exposure to fluctuations in the exchange rate between the Japanese yen and U.S. dollar. The Index also generates exposure to large cap and mid cap equities within Japan.
  • iShares MSCI Japan ETF (EWJ): The iShares MSCI Japan ETF is designed to track the total return performance, before fees and expenses, of the MSCI Japan Index. The index generates exposure to large cap and mid cap equities within Japan. Currency exposure between the yen and the U.S. dollar is not hedged.

We can then use indexes to benchmark the performance back to the U.S. equity experience. We do this because our readers are based in the U.S. and tend to think of Japanese equities at least in part for how they compare to the attributes, including performance, of U.S. equities.
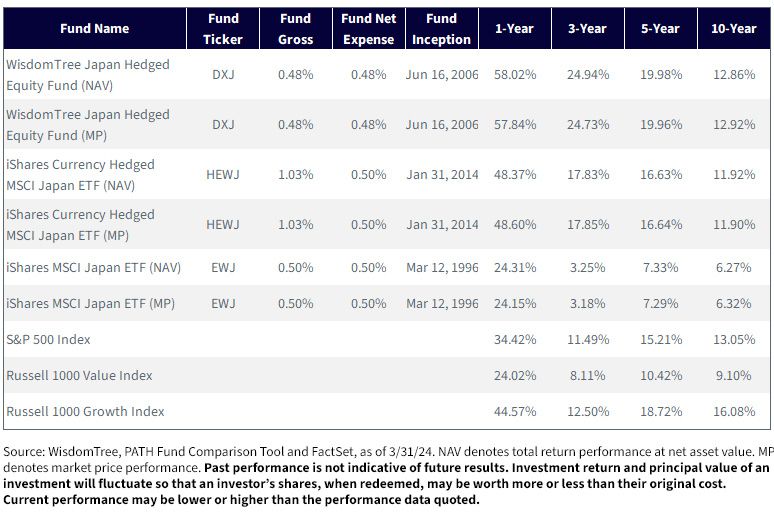
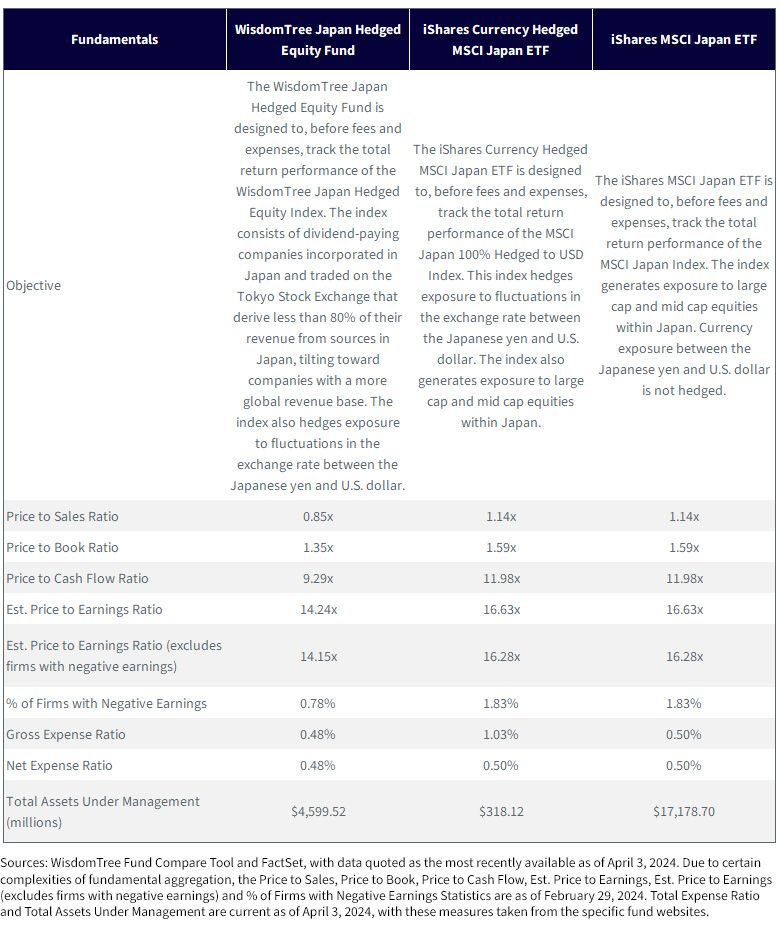
  • S&P 500 Index (500): A broad-based benchmark of U.S. equity performance.
  • Russell 1000 Value Index (RU1000V): A broad-based benchmark of the value-oriented component of the U.S. equity market, typically focused on companies with lower valuation metrics but also slower growth metrics.
  • Russell 1000 Growth Index (RU1000G): A broad-based benchmark of the growth-oriented component of the U.S. equity market, typically focused on companies with higher valuation metrics but also higher growth metrics.

The Most Recent 10 Year Period: Rewarded by U.S. Large-Cap Growth Stocks

Figure 2a: Standardized Performance

Standardized Performance table, as of 3/31/24.

Performance data for the most recent month-end for DXJ is available here.

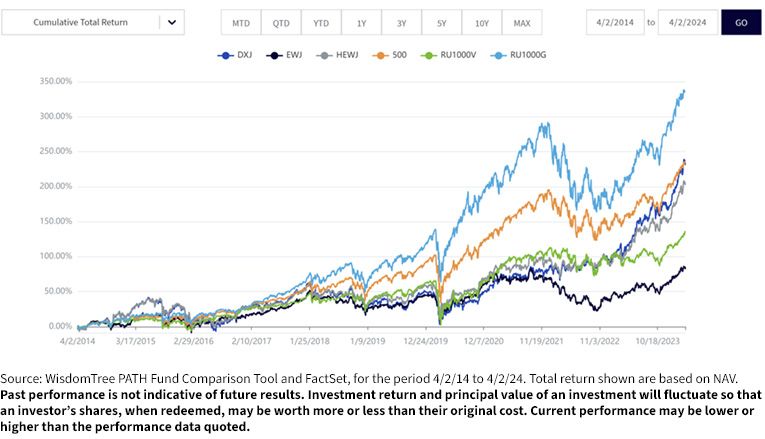
Over the period of 10 years visible in figure 2b, its clear that:

  • The Russell 1000 Growth Index (RU1000G) was the top performer. This probably isn’t surprising to those following the U.S. large-cap growth investment style, which has been strong.
  • The S&P 500 Index (500) was strong as well, but DXJ kept pace, and HEWJ also nearly kept pace. This speaks to how if one focused on Japanese equities and hedged the currency risk—as both DXJ and HEWJ do—the performance of these strategies focused on Japanese equities kept pace with one of the most widely followed performance benchmarks in the U.S. market.

Figure 2b: 10 Years and Massive Outperformance of U.S. Large-Cap Growth

10 Years and Massive Outperformance of U.S. Large Cap Growth graph

Performance data for the most recent month-end for DXJ is available here.

  • In looking at figure 2b, it’s clear that in the “COVID-19 drop,” which bottomed on March 17 at least in our Fund Compare system kicked off a rally.
  • If we start the clock from March 17, 2020—when we know it was a great time to “buy growth,” with hindsight—we get to figure 3. 
  • Would you have guessed that DXJ—which, again, focuses on Japanese exporters and hedges the exposure of the yen currency against the U.S. dollar—beat the Russell 1000 Growth Index over this period? 
  • Would you have guessed that HEWJ—which is simply the MSCI Japan Index, currency hedged—also outperformed the Russell 1000 Growth Index over this period? 
  • EWJ holds the same underlying equity exposure as HEWJ, but it does not hedge the currency exposure of the yen against the U.S. dollar. Over this period, that led to a massive difference in returns. 

Figure 3: DXJ’s Surprise Outperformance over the Russell 1000 Growth Index 

DXJ’s Surprise Outperformance Over the Russell 1000 Growth Index graph

Performance data for the most recent month-end for DXJ is available here.

Conclusion: Everyone Is Worried about Valuations…What about Japan?

We hear a lot of investors concerned about U.S. equity valuations. Companies like Nvidia have delivered incredible recent returns. Many are looking for something else to lead markets from here beyond just the largest, predominantly tech-oriented firms.

One answer—investors can stay in the U.S. and try to look towards value and away from growth. That worked in 2022, and it worked during March 2024—but history has shown that being in the U.S. and not looking to large growth, at least in recent years, has lagged more than it has outperformed.

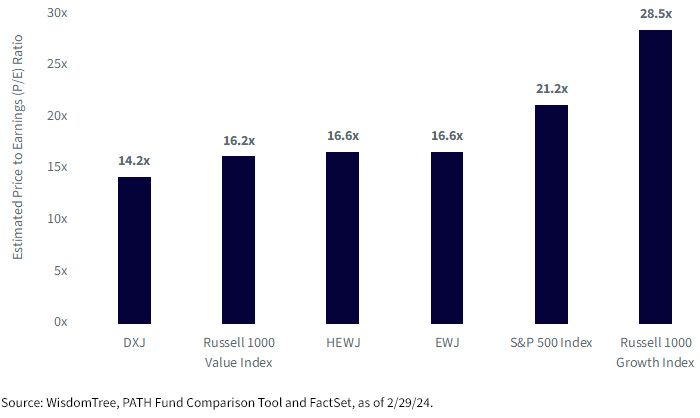
Another answer—and a possible surprise—is that even though Japan has rallied and the Nikkei 225 Index has achieved a recent record, the estimated P/E ratio (shown in figure 4) is about 14 points lower than that of the Russell 1000 Growth Index. We don’t know with certainty whether or not Japan’s rally continues, but we would simply note that if the focus is on Japan’s equities, hedging—taking away the risk of movements in the yen/U.S. dollar exchange rate—is the way to make the investment solely about equities. DXJ is tracking the returns of an underlying index focused on exposure to companies with global earnings—companies with earnings outside of Japan do, in fact, get a boost if the yen is weakening versus other global currencies, like the U.S. dollar.

Figure 4: Japan Offers a Compelling Valuation against U.S. Large Growth

Japan Offers a Compelling Valuation against U.S. Large Growth graph

  • Now, valuation looked at in a vacuum, in our opinion, means nothing. With strong growth in underlying fundamentals, a higher valuation multiple might be “worth it.” 
  • In figure 5, we note the actual growth in operating income for 2023 and then the estimated growth in operating income for 2024 and 2025 for DXJ, EWJ, the S&P 500 Index, the Russell 1000 Growth Index and the Russell 1000 Value Index. In this case, since EWJ and HEWJ have the same underlying stocks, we did not include HEWJ in this figure.
  • The Russell 1000 Growth Index was particularly strong on the growth front in 2023—and we’d note that many of the world’s largest companies that find themselves as constituents in this Index are, in fact, growing their fundamentals quite strongly. The top 10 positions, as of March 31, 2024, included Microsoft, Apple, Nvidia, Amazon.com, Meta Platforms, Alphabet and Tesla—the oft-cited “Magnificent 7” of 2023.6 EWJ was also strong—we looked into this and can note that the recovery in operating income of SoftBank (a constituent), which comes largely from the recovery in the value of its investment portfolio, was a significant driver.
  • 2024 and 2025 estimated growth in operating income show DXJ and EWJ much closer together on these metrics.
  • 2025’s estimated growth in operating income is possibly the most interesting in that one can see the estimates converging. Remember, however, what we saw in figure 4—DXJ has the lowest estimated P/E ratio. If one has an investment horizon beyond a year, this group of export-oriented Japanese companies, weighted by cash dividends, represents a notable way to consider future growth at a reasonable present valuation. Of course, estimates may not bear out and actual results could be higher or lower than predicted.

Figure 5: Additional Information on Funds Prepared in This Report

Additional Information on Funds Prepared in this Report table 

If you are a financial professional and interested in diving more into the comparison of these Funds, please check out our Fund Comparison Tool.


1 Source: Coinbase, Coinbase Bitcoin [CBBTCUSD], retrieved from FRED, Federal Reserve Bank of St. Louis; https://fred.stlouisfed.org/series/CBBTCUSD, 4/4/24.
2 Source: https://goldprice.org/gold-price-history.html
3 Source: Nikkei Industry Research Institute, Nikkei Stock Average, Nikkei 225 [NIKKEI225], retrieved from FRED, Federal Reserve Bank of St. Louis; https://fred.stlouisfed.org/series/NIKKEI225, 4/4/24.
4 Source: Mireya Solis, “Shinzo Abe’s Surprising Victory,” Brookings, 9/28/12. 
5 EWJ is the largest, most longstanding ETF option for U.S. investors focused on passive exposure to Japanese equities. HEWJ represents the currency-hedged version of this strategy. As of April 22, 2024, within the US ETF Japan Stock category, EWJ was the largest ETF on the basis of assets under management (AUM). HEWJ represents the currency-hedged version of the same strategy.
6 Source: Russell 1000 Growth Index factsheet, as of 3/31/24.

Register to get insights from WisdomTree
Individual investors who register can access dashboard, daily blog posts, latest videos, podcasts and stay current with industry insights. On top of that, Financial Professionals get additional access to the tools, technology, resources and support they need to take the business to the next level.

Important Risks Related to this Article

There are risks associated with investing, including possible loss of principal.  Foreign investing involves special risks, such as risk of loss from currency fluctuation or political or economic uncertainty.  Please read the Fund’s prospectus for specific details regarding the Fund’s risk profile.

DXJ: The Fund focuses its investments in Japan, thereby increasing the impact of events and developments in Japan that can adversely affect performance. Investments in currency involve additional special risks, such as credit risk, interest rate fluctuations, derivative investments which can be volatile and may be less liquid than other securities, and more sensitive to the effect of varied economic conditions. As this Fund can have a high concentration in some issuers, the Fund can be adversely impacted by changes affecting those issuers. Due to the investment strategy of this Fund it may make higher capital gain distributions than other ETFs. Dividends are not guaranteed, and a company currently paying dividends may cease paying dividends at any time. 


Back Arrow IconPrevious Post All Blog Posts Menu IconAll Posts Next Post

About the Contributor

Global Head of Research

Christopher Gannatti began at WisdomTree as a Research Analyst in December 2010, working directly with Jeremy Schwartz, CFA®, Director of Research. In January of 2014, he was promoted to Associate Director of Research where he was responsible to lead different groups of analysts and strategists within the broader Research team at WisdomTree. In February of 2018, Christopher was promoted to Head of Research, Europe, where he was based out of WisdomTree’s London office and was responsible for the full WisdomTree research effort within the European market, as well as supporting the UCITs platform globally. In November 2021, Christopher was promoted to Global Head of Research, now responsible for numerous communications on investment strategy globally, particularly in the thematic equity space. Christopher came to WisdomTree from Lord Abbett, where he worked for four and a half years as a Regional Consultant. He received his MBA in Quantitative Finance, Accounting, and Economics from NYU’s Stern School of Business in 2010, and he received his bachelor’s degree from Colgate University in Economics in 2006. Christopher is a holder of the Chartered Financial Analyst Designation.