
Will Interest Rate Headwinds Turn into Tailwinds?


Over the past two years, rising interest rates reversed several longstanding market relationships so significantly that they defy historical precedent.
The most damning evidence is found in the equity market, where newly positive correlations between stock and bond returns eliminate the diversification benefit that existed when the historical relationship was consistently negative. Market commentary has rightfully focused on this, as it newly challenges the conventions of portfolio construction.
But other relationships have been upended as well.
Over the last two decades, equities maintained steadily positive correlations with changes in U.S. Treasury yields, as steady economic growth propelled equity markets higher and provided upward, yet not prohibitive, pressure on rates. This trend was exacerbated by the very nature of a low interest rate environment since yield changes from one period to the next contained an upward bias.
Though it fluctuated throughout the economic cycle, the relationship remained consistently positive for both large caps and small caps. The trend was consistent across all nine U.S. equity size and style combinations as well, with small caps and value styles maintaining slightly stronger relationships than large caps and growth.
Median Rolling 36M Correlation of Russell U.S. Index Family vs. 10-Year Treasury Yield (since 2005)
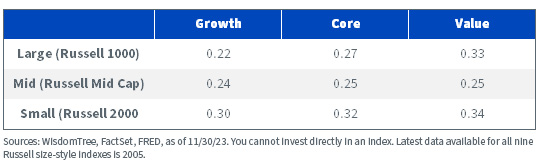
For definitions of indices in the table above, please visit the glossary.
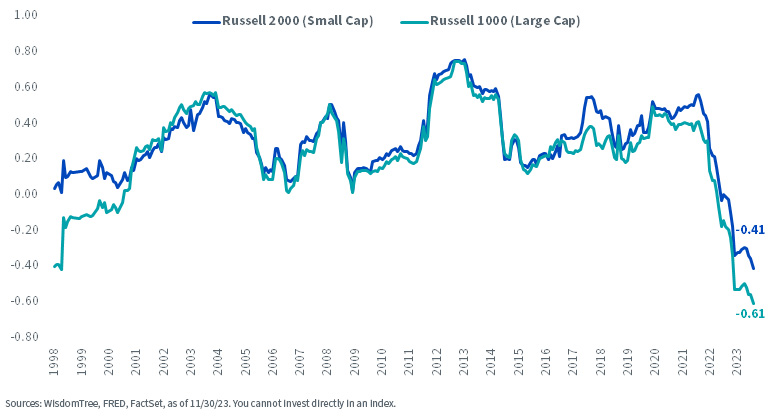
But after more than 500 basis points of cumulative rate hikes over the past two years, the relationship began to break down in late 2021. Two years later, large- and small-cap equities are now deeply negatively correlated with changes in interest rates for the first time in our 25-year data history.
Rolling 36M Correlation: Large Cap & Small Cap Returns vs. Changes in 10-Year U.S. Treasury Yield
Despite the shift, these correlations may suggest near-term upside for equities in the prevailing interest rate environment.
Although rate hikes impeded risk sentiment and embedded most U.S. equity indexes in negative territory for the past two years,1 an eventual monetary policy pivot may revitalize broader optimism. The Federal Reserve has insinuated that it plans to hold interest rates steady over the near term, and that its next policy rate decision is may likely be a rate cut versus another hike, provided there are no positive economic surprises that disrupt the recent trend of softening data.
That means markets are likely atop the interest rate plateau and eagerly await the descent. Once the pivot to policy easing commences, we think a fresh injection of risk appetite will be swift and pronounced.
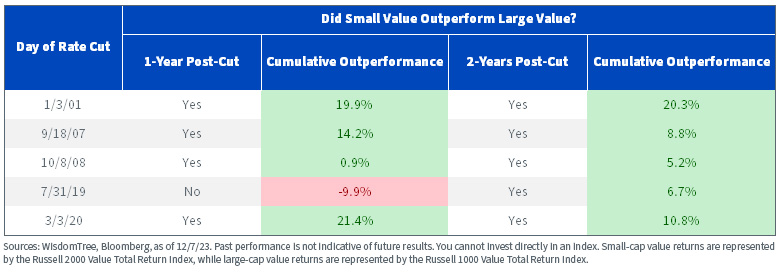
In that scenario, we surmise that traditional risk-on darlings like small cap equities may catch an overdue tailwind. Small-cap value, in particular, has an impressive record of outperformance over large-cap value once the FOMC initially pivots to accommodative policy.
Over the past two decades, the Fed cut rates after prolonged periods of high, or steady, rates on five occasions. During the one- and two-year periods following those reductions, small-cap value outperformed large cap value in nine of ten observations to a compelling extent.
The WisdomTree U.S. SmallCap Fund (EES) recorded even better success over the latter four cuts shown above, outperforming broad small-cap value over the subsequent one- and two-year periods in six of eight observations.
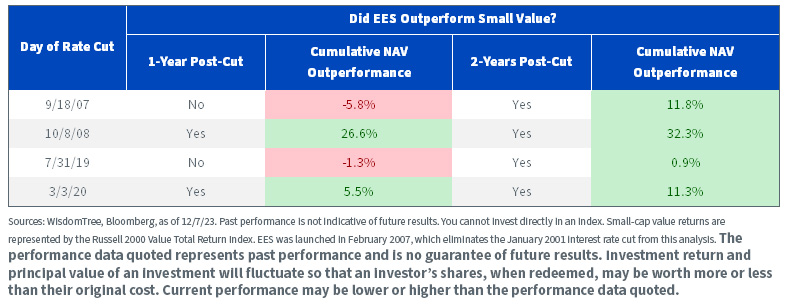
For the most recent month-end performance, standardized performance, and 30-day standardized yield click here.
Three of the four observations across the two-year subsequent returns also notched double-digit outperformance over broader small-cap value.
It also trades at a similar valuation to the broader market,2 which may create an attractive entry point for potential allocations. It currently has an 11.0 times estimated price-to-earnings (excluding negative earners) multiple versus 13.8 times for the Russell 2000 and 11.4 times for the Russell 2000 Value.
Overall, we’re encouraged by the historical track record for small-cap value in the policy environment immediately before and after rate cuts and think the WisdomTree U.S. SmallCap Fund (EES) may be in a suitable position to consider.
1 Source: Bloomberg, as of 12/7/23, covering the period 12/31/21–12/7/23.
2 Sources: WisdomTree, FactSet, as of 12/7/23. You cannot invest directly in an index.
Important Risks Related to this Article
There are risks associated with investing, including the possible loss of principal. Funds focusing their investments on certain sectors and/or smaller companies increase their vulnerability to any single economic or regulatory development. This may result in greater share price volatility. Please read the Fund’s prospectus for specific details regarding the Fund’s risk profile.Share & Comment
Popular Posts
Categories
Related Links
Brian Manby joined WisdomTree in October 2018 as an Investment Strategy Analyst. He is responsible for assisting in the creation and analysis of WisdomTree’s model portfolios, as well as helping support the firm’s research efforts. Prior to joining WisdomTree, he worked for FactSet Research Systems, Inc. as a Senior Consultant, where he assisted clients in the creation, maintenance and support of FactSet products in the investment management workflow. Brian received a B.A. as a dual major in Economics and Political Science from the University of Connecticut in 2016. He is holder of the Chartered Financial Analyst designation.