

Income Sans the Volatility…A Year Later
Published November 29, 2023

Kevin Flanagan
Head of Investment and Fixed Income Strategy
Time sure goes by quickly. A year ago, I wrote a post focusing on an investment solution that aims to provide investors with income but, more importantly, not the elevated volatility that has been witnessed in the bond market over the last two years. Make no mistake—I do believe investors are faced with a new rate regime as we get ready to enter 2024. But sometimes the more things change, the more they stay the same.
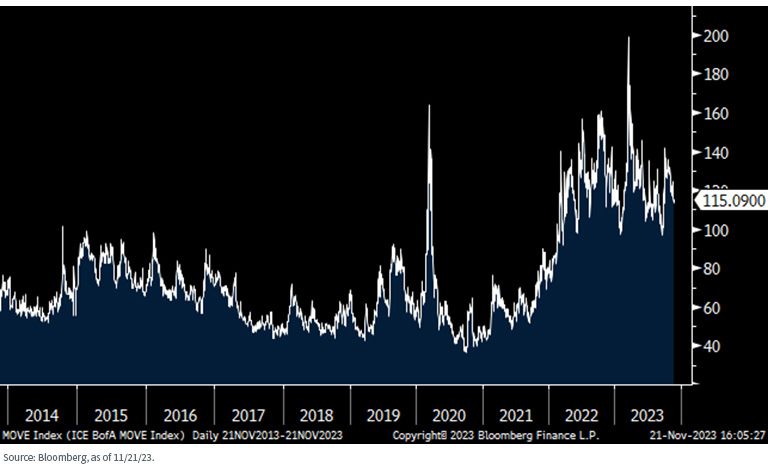
ICE BofA MOVE Index
The Volatility Quotient
Let’s take a look at trading activity in the U.S. Treasury (UST) market and how the volatility quotient has increased in a considerable fashion over the last two years. The ICE BofA MOVE Index measures the implied volatility of UST options across various maturities, such as the 2-, 5-, 10- and 30-Year securities. For those more familiar with the equity side of the ledger, think of the MOVE index as the bond market’s version of the VIX.
As the above graph clearly illustrates, volatility has taken a noteworthy turn to the upside of late, after remaining somewhat stable and/or range-bound from late-2013 up to the Covid-related spike in early 2020. That begs the question: what will the future hold? Well, like in most markets, uncertainty is not a welcome factor in the mix. Unfortunately, it looks as if this issue is not going away any time soon, especially as it relates to monetary policy.
While it appears as if the Federal Reserve may have finally come to the end of hiking rates for this tightening cycle, the two key questions for 2024 will be: 1) how long will the Fed be on hold? and 2) when/how many rate cuts may be in the offing for next year? These unknowns will more than likely create a heightened sense of uncertainty, and when there is uncertainty, there is volatility.
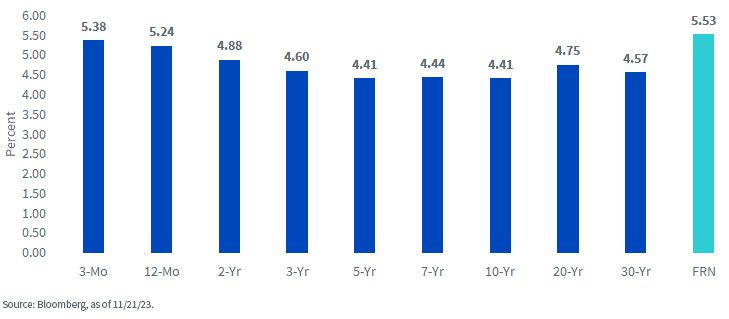
U.S. Treasury Yields
The State of the UST Market
Although the Treasury yield curve has steepened over the last few months, it remains inverted. The magnitude of Fed rate hikes created an environment where ultra-short/short-dated maturities continue to have a yield advantage over their intermediate to longer-dated counterparts. Back to the point I made in the opening paragraph, the more things changed (higher rates such as for the UST 10-Year yield), the more they stayed the same (inverted yield curve).
So, let’s take a look at where key Treasury yields stand to enter the final month of the year. The accompanying graph highlights the widely watched Treasury maturity spectrum, ranging from the 3-month t-bill on out to the 30-Year bond, and of course, the floating rate note (FRN). This way investors can get an up-close look for themselves at the various yield disparities. As we can see, the UST FRN yield stands at 5.53%, as of this writing, or an eye-opening 110 basis points above the UST 10-Year level.
Income without the Volatility?
From an investment perspective, I keep going back to the shape of the Treasury yield curve, and what investors are being compensated for, especially given the potential for continued volatility. With the Fed apparently in no hurry to cut rates any time soon, UST FRNs will continue to play an integral role in a bond portfolio. This strategy provides investors with both income potential and help mitigating the effects of volatility that can be found in fixed coupon securities. The WisdomTree Floating Rate Treasury Fund (USFR) offers investors a means of investing in the UST FRN space.
Important Risks Related to this Article
There are risks associated with investing, including the possible loss of principal. Securities with floating rates can be less sensitive to interest rate changes than securities with fixed interest rates, but may decline in value. Fixed income securities will normally decline in value as interest rates rise. The value of an investment in the Fund may change quickly and without warning in response to issuer or counterparty defaults and changes in the credit ratings of the Fund’s portfolio investments. Due to the investment strategy of this Fund it may make higher capital gain distributions than other ETFs. Please read the Fund’s prospectus for specific details regarding the Fund’s risk profile.
Categories
Related articles

Private Credit Beyond the Headlines: Why Diversification and Liquidity Matter More Than Ever
Are Bessent’s Hands Tied?
‘Warsh’ and Dry

What’s ‘Under the Hood’ of Your Core Bond Position?

Powell Stays…Should the Dot Plot?

Fed Watch: Powell’s Last Stand & What Comes Next?
Inflation’s First Official Debut
Nowhere to Hide…Except Maybe Treasury Floating Rate Notes
How to Mitigate Software Exposure in Bonds
About the contributor

Kevin Flanagan
Head of Investment and Fixed Income Strategy
Kevin serves as the Head of Investment and Fixed Income Strategy. In this role, he writes macro and fixed income-related content and works closely with the sales, research and marketing teams. In addition, Kevin conducts client-facing webinars and meetings, providing expertise on WisdomTree’s existing and future bond ETFs. Prior to joining WisdomTree, Kevin spent 30 years at Morgan Stanley, where he was Managing Director and Chief Fixed Income Strategist for Wealth Management. He was responsible for tactical and strategic recommendations and created asset allocation models for fixed income securities. He was a contributor to the Morgan Stanley Wealth Management Global Investment Committee, primary author of Morgan Stanley Wealth Management’s monthly and weekly fixed income publications, and collaborated with the firm’s Research and Consulting Group Divisions to build ETF and fund manager asset allocation models. Kevin has an MBA from Pace University’s Lubin Graduate School of Business, and a B.S. in Finance from Fairfield University.