
European Equities on Discount: How to Allocate


The European economy is not in free fall, but it is stumbling.
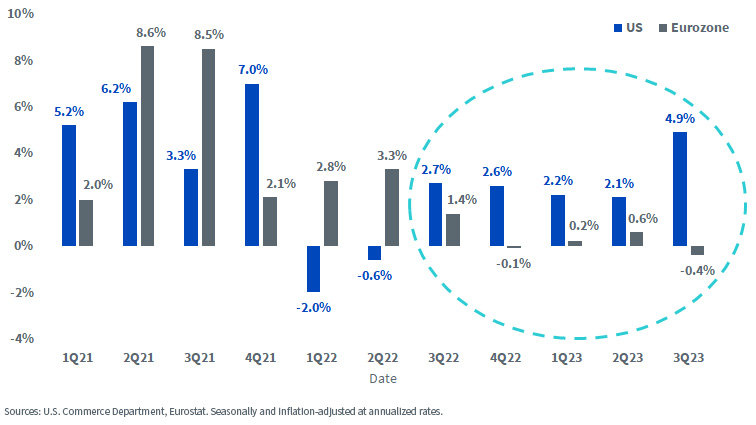
Surprisingly resilient growth in 2022 in the face of the Russian invasion of Ukraine has given way to an economy that is starting to feel the impact of the European Central Bank’s 10 consecutive rate hikes.
On October 26, the ECB announced a pause on its rate-hiking campaign to assess the effect of its monetary tightening.
Meanwhile, U.S. economic growth continues to surprise to the upside.
Quarter-over-Quarter GDP Growth
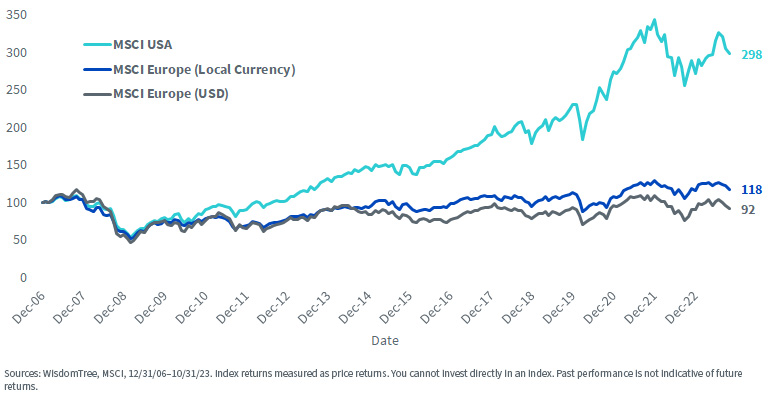
Looking back to just before the global financial crisis, the price returns of European equities measured in local currency (excluding currency fluctuations) have lagged the U.S. by 180% (or 5.7% annualized). Measured in dollars, European equities have lost value in the last 16+ years.
Index Growth of 100 since 2006
For definitions of terms in the chart above, please visit the glossary.
For bargain hunters, the cloudy European economic picture and lagging returns could spell opportunity.
Many investors in U.S. equities are concerned valuations are too stretched, constraining future return expectations.
No such concern exists for European equities.
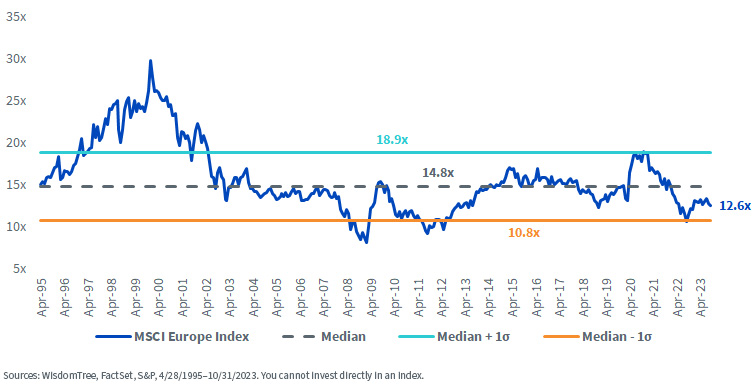
The MSCI Europe Index’s forward P/E ratio of 12.6x is more than two turns below its historical median of 14.8x.
MSCI Europe Index Forward P/E Ratio
Allocating to European Dividend Payers
WisdomTree has four Europe-dedicated equity Indexes. These Indexes rebalance exposures once per year as of an end-of-September screening date. Each Index is composed exclusively of dividend-paying companies and is fundamentally weighted based on the Dividend Stream®.
These Indexes were designed with a focus on being broadly diversified, highly correlated to the representative market cap-weighted indexes and investable.
Each Index is tracked by a related WisdomTree ETF.
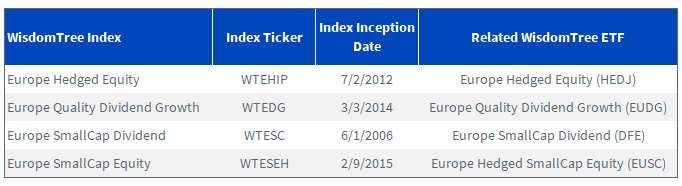
- WisdomTree Europe Hedged Equity – Exposure to European equities while neutralizing (hedging) exposure to fluctuations between the euro and the U.S. dollar. Companies must be domiciled in Europe, trade in euros, have at least $1 billion market capitalization and derive at least 50% of their revenue in the latest fiscal year from countries outside of Europe.
- WisdomTree Europe Quality Dividend Growth – Selects 300 companies from the eligible universe based on their combined ranking of growth and quality factors. The growth factor ranking is based on earnings growth expectations, while the quality factor ranking is based on three-year historical averages for return on equity and return on assets.
- WisdomTree Europe SmallCap Dividend – Comprises the bottom 25% of the market capitalization of the European companies from the WisdomTree International Equity Index after the 300 largest companies have been removed.
- WisdomTree Europe Hedged SmallCap Equity – Exposure to European equities while neutralizing (hedging) exposure to fluctuations between the euro and the U.S. dollar. The Index comprises the bottom 10% of the market capitalization of the European companies traded in euros from the WisdomTree International Equity Index.
The rebalance of these European Indexes took place at the market close of November 8. Below is a summary of the post-rebalance exposures of the Indexes.
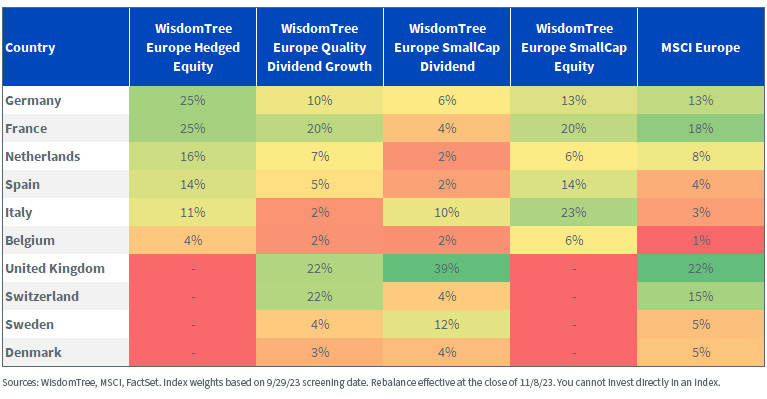
Country Exposures
- Both the Europe Hedged Equity Index and the Europe Hedged SmallCap Equity Index only include countries in the European Monetary Union (EMU), thus excluding countries like the United Kingdom, Switzerland, Sweden and Denmark. Country weights are capped at 25%, which is why we see 25% weights each for Germany and France in the Europe Hedged Equity Index.
- The Europe Quality Dividend Growth Index has a broad-based universe of European equities, including non-EMU countries. Countries are capped at 20% at rebalance, with some deviation due to a 20% sector cap, 5% holding cap and volume adjustments to enhance the liquidity of the Index.
- The Europe SmallCap Dividend Index also has a broad-based universe of European equities. The Index caps countries at 25%, but due to volume adjustments, United Kingdom equities were boosted to a 39% weight at the rebalance.
Index Country Exposures
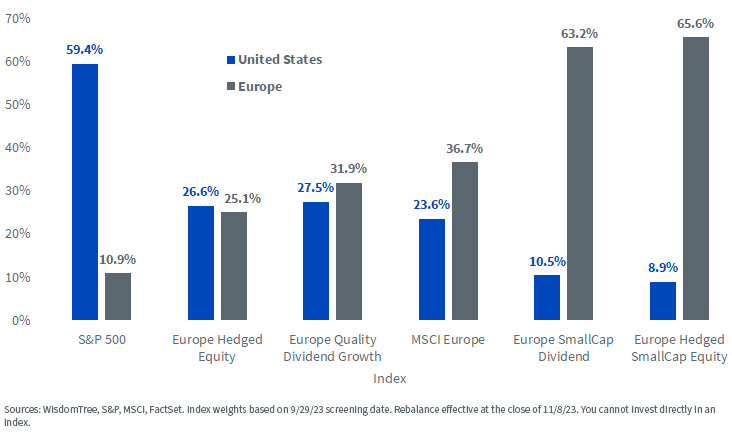
Geographic Revenue
The European economy is much more export-reliant than the U.S.
S&P 500 constituents earn nearly 60% of revenue from the domestic U.S. market. The WisdomTree Europe Hedged Equity Index—populated by large multinational European companies—earns less than half that amount from Europe (25.1%). In fact, that Index earns slightly more revenue (26.6%) from the U.S.
The Europe SmallCap Dividend Index and the Europe Hedged SmallCap Equity Index each earn more than 60% of revenues from the domestic European market, representing exposures more closely tied to European economic conditions.
Index Geographic Revenue
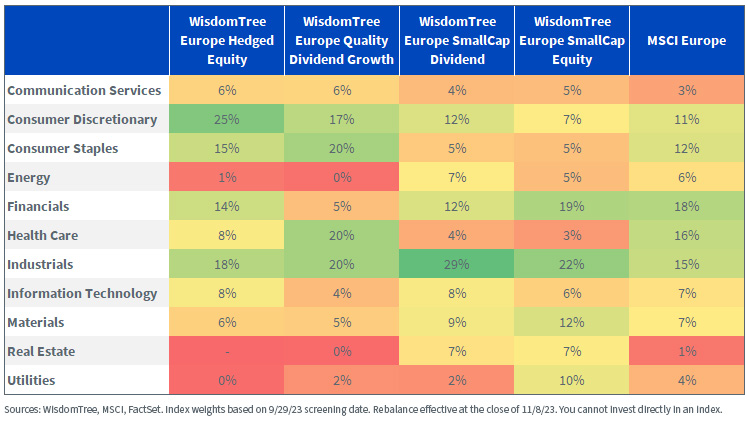
Sector Exposures
- The Europe Hedged Equity Index tilts to exporters, reducing exposure to sectors like Utilities, Real Estate and Energy that earn a great share of their revenue from within Europe. As seen with the top allocation to Consumer Discretionary, sectors are capped at 25%.
- The Europe Quality Dividend Growth Index has historically been under-weight in Financials (5%) relative to market cap-weighted indexes due to the Index’s profitability screens (return-on-equity and return-on-assets). Sectors are capped at 20%, as can be seen with Consumer Staples, Health Care and Industrials.
- The Europe SmallCap Dividend Index and Europe Hedged SmallCap Equity Index each have their largest exposures to Industrials, at 29% and 22%, respectively. Each Index caps sector exposures at 25%, with deviation due to volume adjustments.
Index Sector Exposures
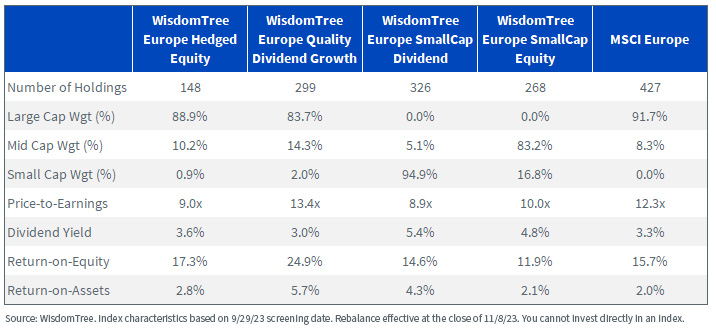
Characteristics
To the earlier point on attractive valuations for European equities, three of the four Indexes have trailing price-to-earnings ratios of 10x or less. These are some of the lowest valuations that can be found in the developed markets.
The Europe Quality Dividend Growth Index, with a P/E ratio of 13.4x, can be explained by the higher quality characteristics (premium ROE and ROA). This Index is over-weight in high-quality sectors like Health Care, Industrials, Consumer Staples and Consumer Discretionary and under-weight in lower-quality sectors like Financials and Energy.
For a basket of high-quality multinational businesses, the Europe Quality Dividend Growth Index is trading at a reasonable multiple when compared to the 22.6x P/E ratio of the S&P 500 Index.
Index Characteristics
For additional details on the rebalance of each of the Indexes, please go to their respective Index pages on the WisdomTree website:
- WisdomTree Europe Equity Index (the WisdomTree Europe Hedged Equity Fund (HEDJ) seeks to track the price and yield performance, before fees and expenses, of this Index)
- WisdomTree Europe Quality Dividend Growth Index (the WisdomTree Europe Quality Dividend Growth Fund (EUDG) seeks to track the price and yield performance, before fees and expenses, of this Index)
- WisdomTree Europe SmallCap Dividend Index (the WisdomTree Europe SmallCap Dividend Fund (DFE) seeks to track the price and yield performance, before fees and expenses, of this Index)
- WisdomTree Europe Hedged SmallCap Equity Index (the WisdomTree Europe Hedged SmallCap Equity Fund (EUSC) seeks to track the price and yield performance, before fees and expenses, of this Index)
Important Risks Related to this Article
There are risks associated with investing, including the possible loss of principal. Foreign investing involves special risks, such as risk of loss from currency fluctuation or political or economic uncertainty. Investments in currency involve additional special risks, such as credit risk and interest rate fluctuations. Derivative investments can be volatile, and these investments may be less liquid than other securities, and more sensitive to the effect of varied economic conditions. As this Fund can have a high concentration in some issuers, the Fund can be adversely impacted by changes affecting those issuers. Due to the investment strategy of this Fund, it may make higher capital gain distributions than other ETFs. Dividends are not guaranteed, and a company currently paying dividends may cease paying dividends at any time. Please read the Fund’s prospectus for specific details regarding the Fund’s risk profile.Share & Comment
Popular Posts
Categories
Related Links