

The Long-Term Winning High-Multiple Stocks
Published August 23, 2023

Jeremy Schwartz, CFA
Global Chief Investment Officer

Joseph Attia
Research Analyst
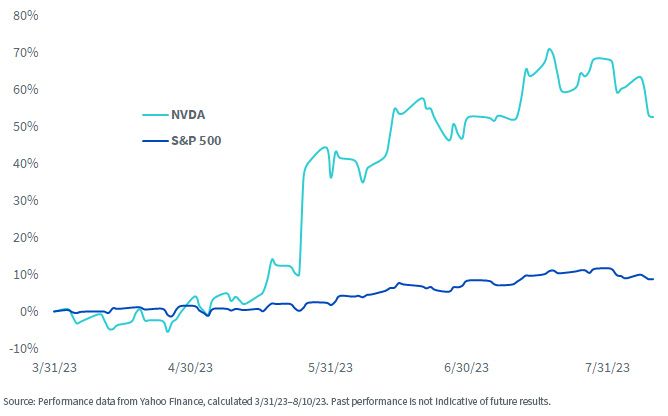
Nvidia became the highest price-to-sales (P/S) ratio stock in the S&P 500 at the end of March 2023 and up until mid-August 2023, returned a total of 52.6% compared to the S&P 500’s 8.7%.1
Our past research showed that the highest-multiple stocks often see momentum that allows them to outperform the following year before they often start to underperform.
But a notable few of the 99 companies that historically reached the highest-multiple status broke through to be long-term winners—and we reveal that list below.
Figure 1: Comparative Performance of Nvidia vs. S&P 500 from March 31 to August 10, 2023
Historical Winners from Top P/S Stocks
Our previous blog post showed that stocks with the top price-to-sales (P/S) ratio return, on average, -2% annually over the next five years, while the broader market showcases an average return of 10% during the same period.
To better understand which companies managed to avoid these disappointing returns, we looked at the winners and their sales growth.
Figure 2: Five-Year Winners from Top P/S Position and Their Sales Growth
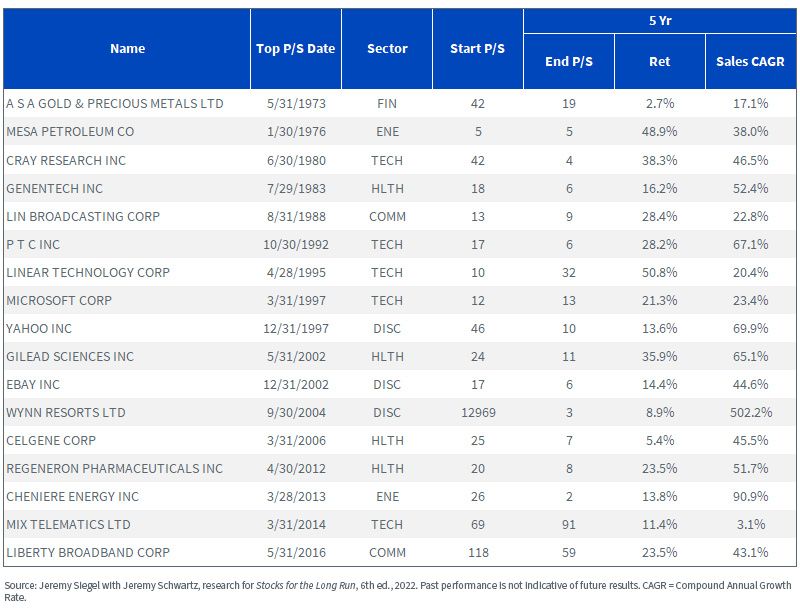
For definitions of terms in the table above, please visit the glossary.
Figure 3: Five-Year Median Sales Growth Top P/S Winners vs. Losers
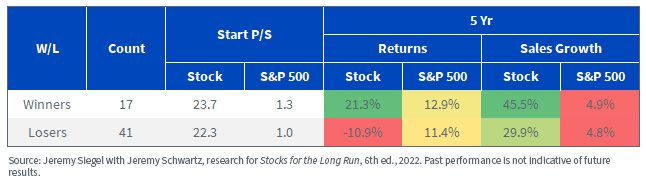
When we look at figure 3, with the aggregated statistics on the sales growth for winners and losers, it’s clear that just growing sales faster than the market is not enough. Even the losing companies grew their sales more than six times faster than the market and still had huge negative returns. Median sales growth for the winning companies is almost 50% annually!
The sales growth that a company must sustain to continue to stay competitive and justify its high multiples doesn’t become easier with longer horizons either.
For every surviving company that also beat the S&P 500 over the next five years, there were 2.4 that underperformed.
Figure 4: Ten-Year Winners from Top P/S Position and Their Sales Growth
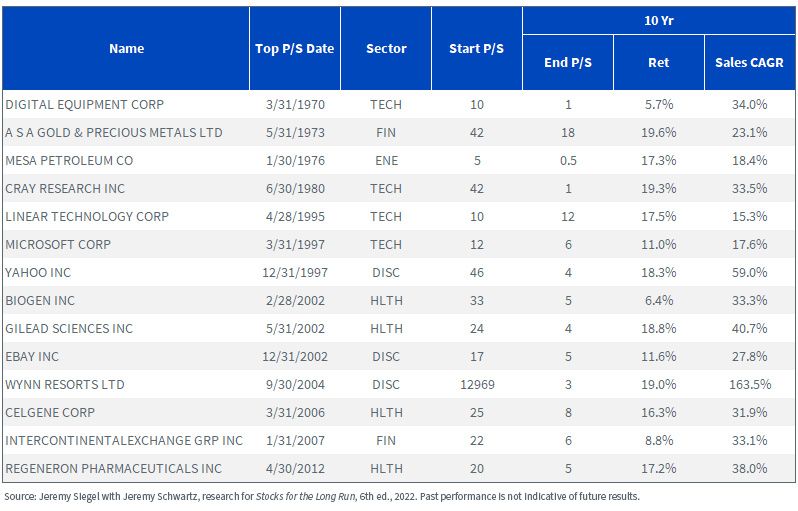
Figure 5: Ten-Year Median Sales Growth Top P/S Winners vs. Losers
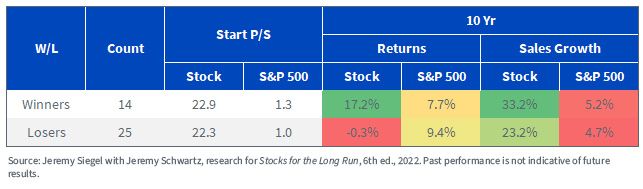
Looking at those that outperform for the next decade, there are even fewer survivors. The losing companies experienced negative annual returns even with their sales growing 23.2% annually. The winners grew their sales at 33.2% per year, whereas the market only achieved a 5.2% annual growth rate.
Bucketing Winners and Losers by P/S Ratio
Similar to how in the last blog post we looked at top P/S stocks in one view, then took a step back to look at every entry in the largest 500 companies, we can do the same here and examine their sales growth.
Figure 6: One-Year Median Sales Growth Winners vs. Losers
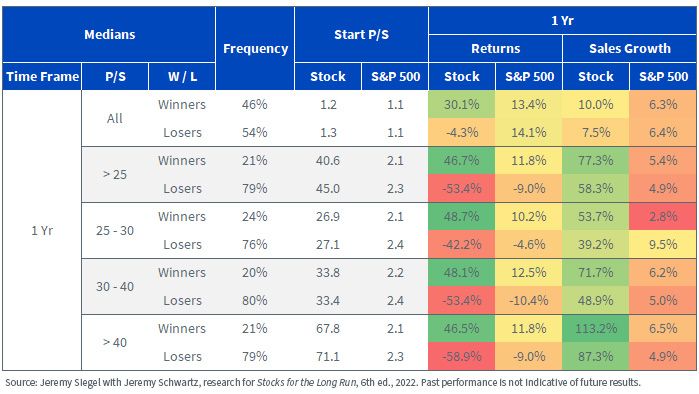
For the next 12 months, we see that the odds of a stock outperforming aren’t that bad. It’s right under half for all stocks, sitting at 46% historically. At higher multiples, these odds halve and result in about a quarter of the higher-valuation stocks outperforming.
Figure 7: Five-Year Median Sales Growth Winners vs. Losers
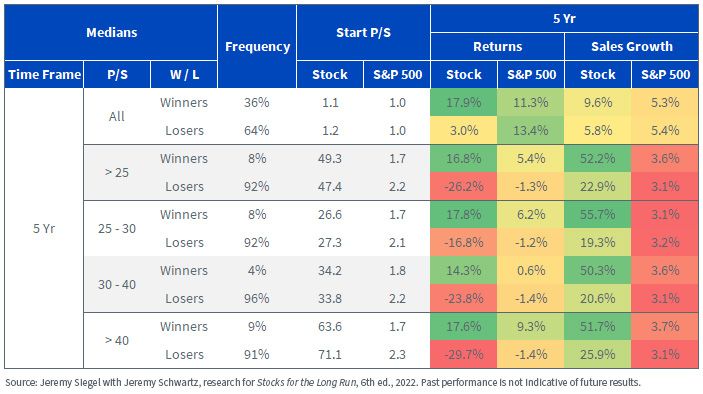
On the five-year horizon, we see a huge difference in the chances that a company outperforms the market. As a base rate, we see 36% of the stocks outperform the S&P 500, but when we look at higher multiples, we find the chance that a company outperforms is four times less likely, with only 9% of stocks outperforming.
Figure 8: Ten-Year Median Sales Growth Winners vs. Losers
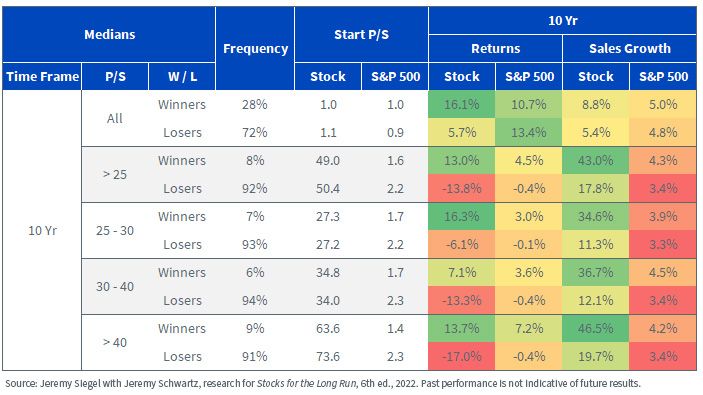
Across the different time horizons, there’s a discernible trend in the relationship between P/S ratios, sales growth and stock performance. Looking from 1-year horizons to 10-year horizons, winners consistently achieve long-term astronomical sales growth rates that eclipse not only the broader market but also their high P/S peers.
For example, in the elevated P/S category (>40), winners achieve annual sales growth rates of 113.2% over one year, 51.7% over five years and 46.5% over a decade.
These figures starkly contrast with their underperforming counterparts in the same P/S bracket, though even the losers grow faster than the market.
The data paints a compelling picture—while robust sales growth is commendable, to truly outperform in the high P/S arena, companies need to deliver growth that’s not just good but consistently exceptional.
Allowing a forward-looking P/S ratio for Nvidia puts it into the >25 P/S bucket, where winners have, on average, grown their sales by more than 50% a year. For the 12 months prior to April 30, 2023, Nvidia had total sales of around $26 billion. Growing that at 50% a year means that in 2028, its annual sales would reach more than $197 billion a year—a staggering sales number that only about 30 companies worldwide surpass currently.
This number becomes even more daunting when we consider the fact that estimates put the total size of the AI GPU market at between $120 billion and $150 billion by 2028.2
This makes it very unlikely that Nvidia can grow its sales by 50% a year, even if it has 100% of the market, if demand doesn’t grow at that rate.
One of the most promising things, then, that investors can look for is proof that Nvidia can hold on to its share of the market, estimated to be between 80% and 90% right now.3 There aren’t many examples of companies in this position to learn from, but the one Nvidia resembles the most today is Cisco in the early 2000s. We will review some similarities with Cisco in our next piece in this series.
1 Period is defined as 3/31/23–8/10/23.
2 Source: AI Chip Market Report, Statista Intelligence, 2023.
3 Source: Stephen Nellis and Chavi Mehta, “With No Big Customers Named, AMD’s AI Chip Challenge to Nvidia Remains Uphill Fight,” Reuters, 6/13/23.
Categories
Related articles

Can America Build Things? Tracking U.S. Progress in Robotics and Drone Manufacturing

Mind the Bottlenecks: How AI Infrastructure Exposure Separates Today's Technology Strategies

Trump, Xi, and the Strategic Processing Reserve

When AI Leaves the Screen and Enters the Physical World

When Imagination Runs into Physics

Behind the Charts: Is the Energy Trade Running Out of Fuel?

The Company at the Center of the AI Economy
‘AI Security’ Emerges as the Next Cybersecurity Theme
A Dog, a Diagnosis and a Different Way to Understand AI
About the contributors

Jeremy Schwartz, CFA
Global Chief Investment Officer
Jeremy Schwartz has served as Global Chief Investment Officer since November 2021 and leads WisdomTree’s investment strategy team in the construction of WisdomTree’s equity Indexes, quantitative active strategies and multi-asset Model Portfolios. Jeremy joined WisdomTree in May 2005 as a Senior Analyst, adding Deputy Director of Research to his responsibilities in February 2007. He served as Director of Research from October 2008 to October 2018 and as Global Head of Research from November 2018 to November 2021. Before joining WisdomTree, he was a head research assistant for Professor Jeremy Siegel and, in 2022, became his co-author on the sixth edition of the book Stocks for the Long Run. Jeremy is also co-author of the Financial Analysts Journal paper “What Happened to the Original Stocks in the S&P 500?” He received his B.S. in economics from The Wharton School of the University of Pennsylvania and hosts the Behind the Markets podcast. Jeremy is a member of the CFA Society of Philadelphia.
