
Searching for Value in 2023? Look at Share Buybacks!


As we position for 2023, which of these styles is going to lead—growth or value? Major growth-to-value rotations, like we saw in 2022, can often be the harbinger of a multi-year trend.
Below I drill into what is meant by “value” or “growth” and what different definitions of the terms mean. But one factor leads to a quite polarizing bifurcation of performance regarding net share issuance:
- Certain companies tend to increase their number of shares outstanding over time. Usually, shares are issued because a company needs to raise more capital or is doing a lot of share-based compensation.
- Certain companies tend to decrease the number of shares outstanding over time. These companies have excess capital they deploy into buying shares. A company cannot sustain this over longer periods if they are not profitable, even if there are ways to undertake this over the shorter term by issuing debt.
This simple distinction between a Share Issuer1 and a Share Reducer2 has been a rather powerful indicator of return potential.
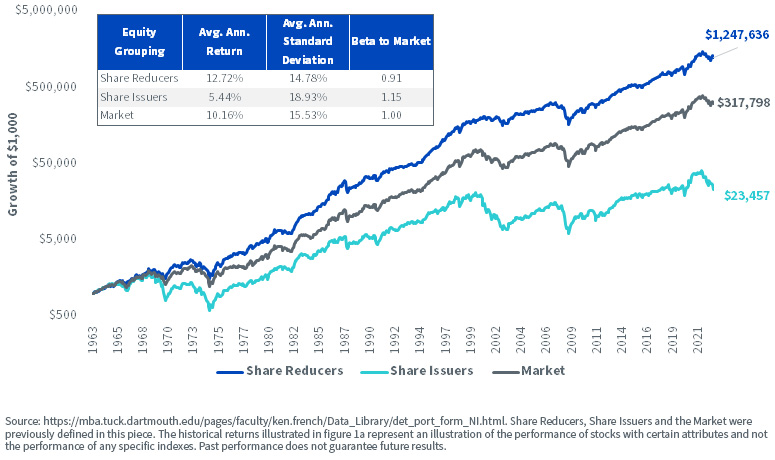
In figure 1a, we examine the difference in returns over a very long period. Looking under the hood:
- The Share Reducers outperformed the Share Issuers by more than 700 basis points PER YEAR, going back to a starting point on June 30, 1963. While we doubt the typical investor is thinking in 60-year increments, this emphasizes that there is something very different going on in these two groups of companies.
- The Share Reducers achieved their performance with a lower measure of risk on this basis than the overall Market3. The beta, another measure of risk against the market benchmark, was 0.91 for Share Reducers.
- A beta below 1.00 and a standard deviation below that of the market could mean it is a bit easier to stick with the strategy, mitigating the wide swings in more volatile approaches.
Figure 1a: Cumulative Difference in Returns
We Also Love to Harken back to History…
With the start of 2023, we’ve also been hearing a bit about history:
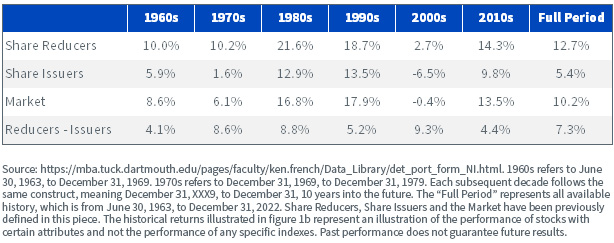
- Will the 2020s look like the 1970s? People ask this question because inflation was high in the 1970s, and inflation was the big narrative in 2022.
- The Share Reducers returned 10.2% per year in the 1970s, whereas the Share Issuers returned 1.6% per year.
- Will the 2020s look like the 2000s? People look at the run-up in speculative “stay at home” tech stocks in 2020 after a period of ultra-low interest rates and outperformance of the growth style.
- The Share Reducers returned 2.7% per year during the 2000s, delivering a positive return during a period where the market was actually down on a 10-year basis.
WisdomTree’s Take on Share Buybacks as a Means to Find a “Value”-Oriented Strategy
Since December 18, 2017, the WisdomTree U.S. Value Fund (WTV) has been undertaking an investment process to focus on companies emblematic of the “value” style.
Of course, the next question has to be—what is value?
There are a variety of definitions, from the simpler “book-to-market value” ratio to the more complex approaches that include multiple different fundamental ratios. There is not necessarily a single fundamental that works perfectly to define value across every type of company and business model.
WTV focuses primarily on “total shareholder yield,” combining the dividend yield and the net buyback ratio. A high total shareholder yield indicates the company is returning strong amounts of capital to shareholders compared to its market price.
The Value Index Discussion Has Gotten a Bit “Spicy” of Late…
S&P undertook its regular rebalance process in December 2022. Part of the criteria between its growth-oriented and value-oriented benchmark indexes factored in momentum.
- Historically, stronger, positive momentum tended toward the growth side of the spectrum.
- Weaker, negative momentum tended toward the value side of the spectrum.
This all makes sense until we look at the sector dispersion in returns observed in 2022.4
The best-performing sector was Energy! Energy is a classic “value” sector, and even today, it sports among the lower valuation metrics of any sector. However, due to its strong, positive momentum, Energy saw its weight increase in growth benchmarks, which meant it necessarily had to decrease in the value benchmark from the S&P classification system.
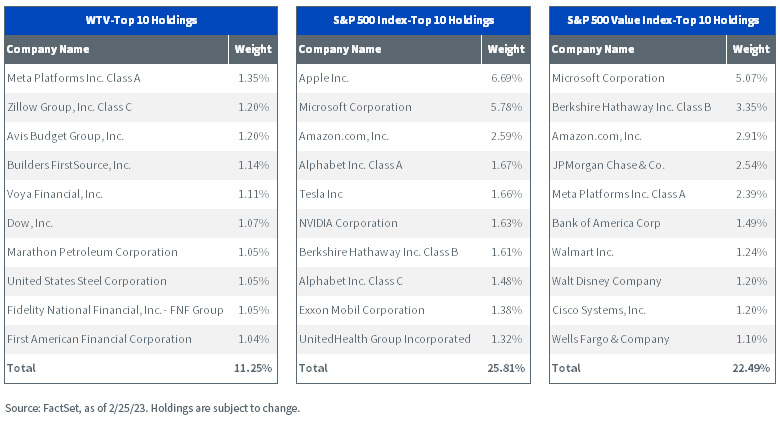
The worst-performing sector in 2022 was Information Technology. That led to weight being added to this sector within the S&P Value Index series—and it was taken away from the exposure of the Growth Index. One of the results of that we see clearly in figure 2 (hence the “spice” in the discussion):
- Microsoft is now the top holding in the S&P 500 Value Index. Amazon.com is the third-biggest position. Meta Platforms is in position 5. While it didn’t crack the top 10, Netflix was the 14th-largest position in the S&P 500 Value Index.
- WTV, with its focus on value, agrees with the classification on Meta Platforms—it was the number 1 holding. Meta was widely in the news throughout 2022, as CEO Mark Zuckerberg clearly stated his intentions for the metaverse and the spending to achieve his goals. While the company churned out cash, markets focused on all of the metaverse spending—and dubious initial results—alongside the general negative sentiment around the Facebook side of the platform. The market seemed to forget the company’s advertising revenues, which, though potentially not growing, were also not dwindling away to zero and remained very, very large. 2022 was a very interesting time, in our opinion, to think about an allocation to this veritable “cash flow machine.”
- Microsoft, Amazon.com, Cisco Systems—while these other Technology-oriented companies were not “perfect” and did have their share of issues in 2022, none were picked up as exemplifying “value” by virtue of WTV’s process. We believe the bar should be high to prove a “value” orientation, and weak momentum on a 12-month basis would not get us there alone for any stock.
Figure 2: A Spicy Comparison of Top 10 Positions
Click here for a full list of Fund holdings.
From Opinion to Black & White Facts
As to the bottom line of different Index methodologies, we’d recommend looking at figure 3, which showcases an array of valuation indicators.
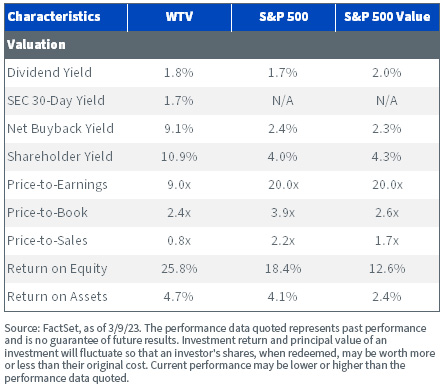
- WTV’s dividend yield: in line with that of the S&P 500 and S&P 500 Value Indexes. No major differences here.
- WTV’s net buyback yield was in a completely different ballpark—9.1%. The figure for the S&P 500 and S&P 500 Value Indexes was only 2.4% and 2.3%, respectively.
- Since shareholder yield is defined as the sum of dividend yield and net buyback yield, the next page of the story is very clear. WTV had a double-digit value of 10.9%. Both the S&P 500 and S&P 500 Value Indexes were below 5.0%.
- Many people like to see a “single-digit” price-to-earnings (P/E) ratio. WTV delivered this—9.0x. The S&P 500 Index was 20.0x, and the S&P 500 Value Index was 20.0x. Read that again—the S&P 500 and S&P 500 Value Indices had the same P/E ratio. The “value” discount in the S&P 500 Value Index is therefore hard to discern on P/E ratios.
- WTV also delivered a much lower price-to-sales ratio—below 1.0x—while the S&P 500 Value Index was 1.7x and the S&P 500 Index was 2.2x.
- A classic approach to value—one that has a P/E ratio less than half that of the other benchmark indexes—should be vulnerable with respect to quality and profitability ratios. Usually, the market pays up with higher multiples on faster-growing, higher-quality companies.
- Two stats to look at on a quality basis are return on equity (ROE) and return on assets (ROA). This is where WTV stands out from other value approaches: delivering an ROE of 25.8%, while the S&P 500 Index was only 18.4%. The S&P 500 Value Index was well behind—12.6%. ROA showed a similar pattern, with WTV, the S&P 500 and S&P 500 Value Indexes showing 4.7%, 4.1% and 2.4%, respectively.
So, in figure 3, we see an approach tilting further along the value spectrum into less-expensive stocks AND also maintaining a stronger focus on some critical quality metrics.
This is all by design, with WTV’s process including a multifactor scoring system that selects good value on shareholder yield as well as high-quality stocks on these types of profitability ratios. Our thought was simple—it’s possible to find value without sacrificing quality.
Figure 3: Value & Quality Characteristics
For the most recent month-end performance and SEC Standardized click here.
For definitions of terms in the table above please visit the glossary.
Bottom Line: Maybe Those Following the S&P 500 Value Index Need a New Approach
WTV’s approach, on the other hand, seeks to manage valuation risk no matter what the market throws its way, as its investment process is designed to evolve with the times.
1 Share Issuers: Sourced from the Kenneth French Data Library, taken from the universe of all U.S.-listed companies as those that are in the top 20% when ranked on the basis of share issuance and would represent some of the biggest “share issuers” over time. The universe is screened annually in June.
2 Share Reducers: Sourced from the Kenneth French Data Library, taken from the universe of all U.S.-listed companies as those where there would be a reduction in the shares outstanding over the annual period, measured in June of each year.
3 Within the context of figure 1a, the Market is represented by all publicly listed U.S. equities, weighted on the basis of their market capitalizations.
4 The following discussion of sectors is based on the S&P 500 Index universe, so when we say “Energy,” for example, we mean the stocks within the S&P 500 Index universe that are classified within the Energy sector.
Important Risks Related to this Article
There are risks associated with investing, including the possible loss of principal. Funds focusing their investments on certain sectors increase their vulnerability to any single economic or regulatory development. This may result in greater share price volatility. While the Fund is actively managed, the Fund’s investment process is expected to be heavily dependent on quantitative models, and the models may not perform as intended. Please read the Fund’s prospectus for specific details regarding the Fund’s risk profile.Share & Comment
Popular Posts
Categories
Related Links
Christopher Gannatti began at WisdomTree as a Research Analyst in December 2010, working directly with Jeremy Schwartz, CFA®, Director of Research. In January of 2014, he was promoted to Associate Director of Research where he was responsible to lead different groups of analysts and strategists within the broader Research team at WisdomTree. In February of 2018, Christopher was promoted to Head of Research, Europe, where he was based out of WisdomTree’s London office and was responsible for the full WisdomTree research effort within the European market, as well as supporting the UCITs platform globally. In November 2021, Christopher was promoted to Global Head of Research, now responsible for numerous communications on investment strategy globally, particularly in the thematic equity space. Christopher came to WisdomTree from Lord Abbett, where he worked for four and a half years as a Regional Consultant. He received his MBA in Quantitative Finance, Accounting, and Economics from NYU’s Stern School of Business in 2010, and he received his bachelor’s degree from Colgate University in Economics in 2006. Christopher is a holder of the Chartered Financial Analyst Designation.