
Look to New Economy Real Estate in 2023


As we start 2023, every asset class is experiencing its own version of adjustment. Part of that adjustment includes looking forward to a possible recession—likely at least part of the reason why valuations in many places dropped so significantly during 2022. Part of that adjustment includes an expectation that the U.S. Federal Reserve is unlikely to raise its policy rate another 400 basis points (or more). Part of that adjustment includes expectations for a moderation of inflation, which is already coming down on many measures, at least for those of us looking at the U.S. economic picture.
The Performance Evolution of New Economy Real Estate
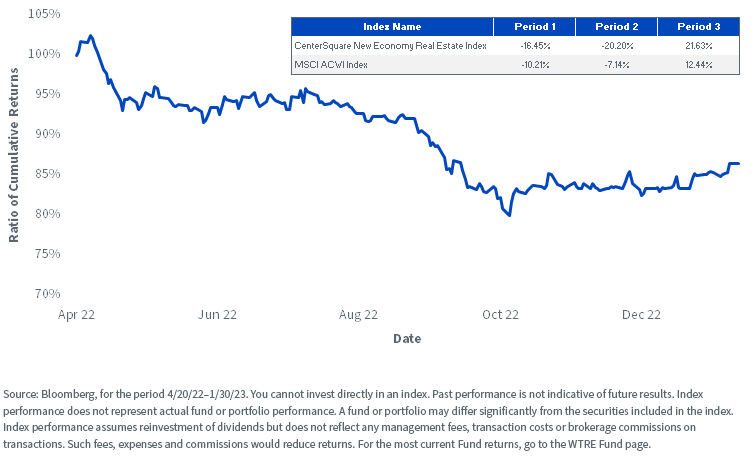
In figure 1, we plotted a ratio of the cumulative return of the CenterSquare New Economy Real Estate Index (New Economy Real Estate) versus the MSCI ACWI Index (Global Equities). While it sounds complicated, operationally speaking:
- If the chart is sloping downward from left to right, that tells us New Economy Real Estate is underperforming Global Equities.
- If the chart is sloping upward from left to right, this tells us that New Economy Real Estate is outperforming Global Equities.
The WisdomTree New Economy Real Estate Fund (WTRE) shifted its objective and investment strategy on April 20, 2022, and began tracking the Index, which is why figure 1’s period starts on that date. Looking more deeply at figure 1, we see three distinct periods by virtue of the shifts of the slope of the line.
- Period 1 (April 20, 2022, to May 10, 2022): We clearly see the steep downdraft in the slope, which tells us that New Economy Real Estate underperformed Global Equities.
- Period 2 (May 10, 2022, to October 24, 2022): There was a continued downtrend—which tells us that New Economy Real Estate was still underperforming Global Equities—but it occurred over a longer period of time than what we saw in period 1.
- Period 3 (October 24, 2022, to January 30, 2023): These charts are the most interesting when you get a shift, and even if the positive slope is not massive in period 3, it is there—this means that New Economy Real Estate started outperforming Global Equities.
Our main thesis is that there is a potential for New Economy Real Estate companies to offer a differentiated way to have “tech exposure” when people may be looking to dial back their exposure to general tech companies.
Figure 1: Evolution of Performance of New Economy Real Estate vs. Global Equities
Segments of New Economy Real Estate
But can we drill down to look at three specific areas in real estate? WisdomTree works with CenterSquare, an asset manager with deep experience and expertise in real estate, to define an approach to “New Economy Real Estate,” which focuses on:
- Cell towers
- Data centers
- Industrial warehouses tilting more in the direction of ecommerce and technology
While one can never know exactly how a given business or area of a market will respond in difficult economic conditions, there is a rationale to believe that it’s at least possible that these areas within real estate could tend to be more resilient than general real estate more broadly.
Relating to the Well-Known “Pandemic Pull-Forward”
When we say “pull-forward,” we specifically mean how the world, in short order, was forced to adjust to an environment where office work shifted from going to a specific location each day to working from home and ultimately working from anywhere. To make this work, many people and many companies bought a lot of new hardware. Those purchases occurred during 2020, largely, and in many cases, that hardware does not necessarily need to be replaced immediately and may not even need to be repurchased at quite the same scale as during that unique time in our history.
Looking at cell towers in this context, one word tends to come up: resilience. Now, if the goal is to find what should provide the greatest sensitivity in an upward-trending market, cell towers are not likely to fit the bill. They tend to operate under more long-term leases with stable, predictable cash flows. Cell towers are not expected to have wide swings in their perceived value, whether in the upward or downward directions. When considering what type of force could drive value within cell towers, it’s more important to recognize the current 5G spending cycle that carriers are involved in. Any spending related to this was more aligned with the need to generally upgrade systems due to client demand to be able to deal with more data faster, and this trend marches forward, seemingly without regard for either economic or pandemic-related conditions.
Data centers, on the other hand, did see a massive pull-forward. Logically, this makes sense, in that if people really did buy all that hardware and then did start working from their homes—and ultimately from anywhere—data centers needed to have the capacity to support the various productivity applications (like Zoom Video Communications or Microsoft Teams) at the vastly increased levels of demand. If we look at the recent past quarters of activity, five out of six saw all-time records in terms of the domestic uptake of space for data centers. It would be impossible to expect this type of trend to continue indefinitely, but it is important to remember that even if there is a moderation, people aren’t demanding to use less data, and such a thing is not expected in the foreseeable future.
Valuations Corrected Significantly during 2022
We recognize that many investors may not be regularly tracking different valuation metrics for real estate, much less tracking the metrics that define specific underlying types of real estate. Stepping back for a moment, we should define some of the statistics that we believe are appropriate to contextualize the different types of real estate we are about to drill down on:
- For cell phone tower REITs and REITs involved in logistics on the industrial side, we look at price/adjusted funds from operations (P/AFFO) over the next 12 months (NTM). The adjusted funds from operations are a way to see a measure of the cash flows available to shareholders in the REIT, as well as provide a sense of the REIT’s future potential to pay dividends.
- For data center REITs, we look at the relationship between enterprise value and earnings before interest, taxes, depreciation and amortization over the coming 12 months—typically termed “next 12 months” (EV/EBITDA NTM).
As is always the case, there is no perfect measure and nothing we can look at that tells us the coming period’s returns with certainty, but we believe that these metrics give the fairest view of these particular parts of the real estate market.
Looking at figure 2:
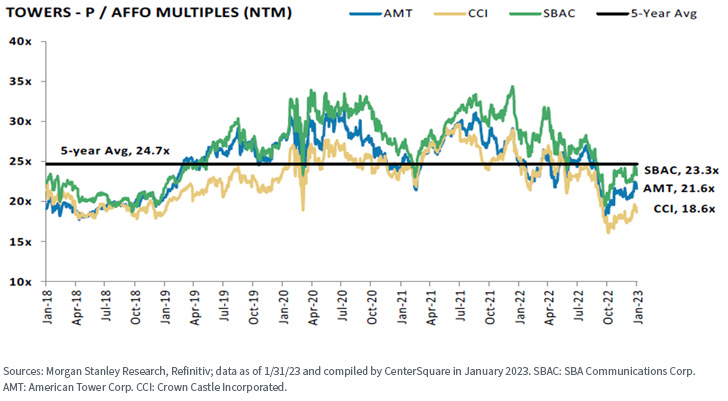
- The five-year average P/AFFO Multiple NTM was 24.7x, looking at three very large operators. Each of those operators is now tracking below this level by this metric after starting 2022 with all three trading above this average level.
- When looking at cell phone tower REITs, it’s important for investors to remember that many of the deals related to the underlying cash flows are set for long periods of time. The dominant factor influencing the market is more likely to be the transition of the world from 4G LTE standards to 5G standards, which is a massive investment for wireless providers. The macroeconomic environment matters, but the pull from all angles to be able to process and transmit more data faster is inexorable.
Figure 2: Cell Phone Tower REITs
Looking at figure 3:
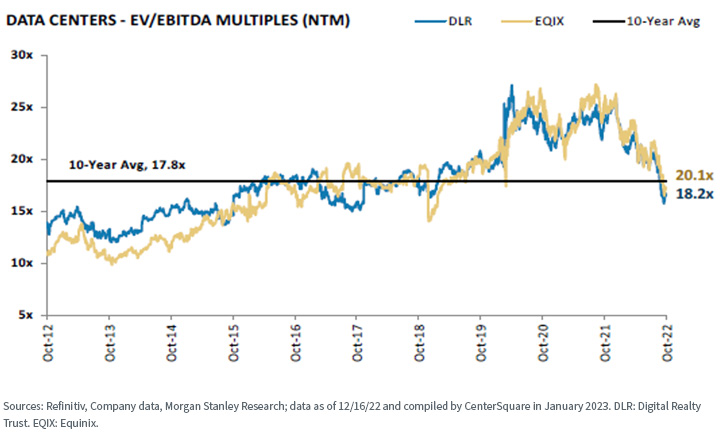
- We’d start any commentary on data center REITs by admitting that those waiting for these assets to be “cheap” on a valuation basis may have a long time to wait. Looking at two large operators, we see that the 10-year average EV/EBITDA Multiple (NTM) was 17.8x. Equinix corrected but still trades above this figure. Digital Realty Trust also corrected, and it also still trades above this level.
- Similar to what we said about cell phone towers, there are forces here that pull the valuations higher that are independent of the macroeconomic picture. People and businesses are both using and storing more data. A lot of the hype about artificial intelligence has to do with excitement around being able to process this data. Even if economic growth has been slowing in many corners of the world, the generation and processing of data have not been slowing. We’d note, however, that neither DLR nor EQIX is trading near where they were on a valuation basis in 2020 and 2021.
Figure 3: Data Centers
Looking at figure 4:
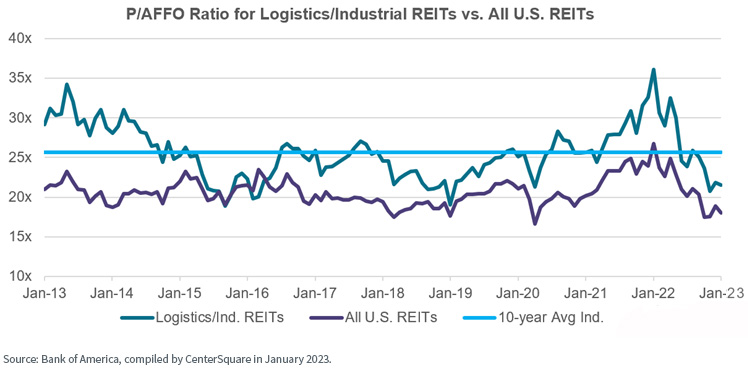
- Logistics/industrial REITs are trading at a premium P/AFFO ratio when viewed relative to all U.S. REITs. Still, this figure has gone from a high of nearly 35.0x to something closer to 20.0x. The average over the prior 10 years is close to 25.0x.
- Those logistics/industrial REITs involved with utilizing technology to deliver goods to consumers faster are still in high demand and seeing a lot of activity. We believe that the premium multiple relative to the market does make sense, and the correction in valuation from 35.0x to roughly 20.0x does reflect the shift in economic growth expectations.
Figure 4: Industrials Involved with Logistics
Bottom Line: Possibility of Strong Growth at a More Reasonable Price
As of December 31, 2022, the CenterSquare New Economy Real Estate Index demonstrated weighted average EBITDA growth of 15.08%. Broad real estate benchmarks, as of that same period, were in the roughly 7%–8% range for this metric. This tells us that a focus on technology within Real Estate has been demonstrating growth. If this premium growth relative to the broader market can be maintained—and we believe that it can, especially relative to older office buildings and strip malls—2022’s correction could represent an interesting catalyst to more closely review the sector.
Important Risks Related to this Article
There are risks associated with investing, including possible loss of principal. Foreign investing involves special risks, such as risk of loss from currency fluctuation or political or economic uncertainty. Investments in real estate involve additional special risks, such as credit risk, interest rate fluctuations and the effect of varied economic conditions. A Fund focusing on a single country, sector and/or emphasizing investments in smaller companies may experience greater price volatility. The Fund invests in the securities included in, or representative of, its Index regardless of their investment merit and the Fund does not attempt to outperform its Index or take defensive positions in declining markets. Please read the Fund's prospectus for specific details regarding the Fund's risk profile.Share & Comment
Popular Posts
Categories
Related Links
Christopher Gannatti began at WisdomTree as a Research Analyst in December 2010, working directly with Jeremy Schwartz, CFA®, Director of Research. In January of 2014, he was promoted to Associate Director of Research where he was responsible to lead different groups of analysts and strategists within the broader Research team at WisdomTree. In February of 2018, Christopher was promoted to Head of Research, Europe, where he was based out of WisdomTree’s London office and was responsible for the full WisdomTree research effort within the European market, as well as supporting the UCITs platform globally. In November 2021, Christopher was promoted to Global Head of Research, now responsible for numerous communications on investment strategy globally, particularly in the thematic equity space. Christopher came to WisdomTree from Lord Abbett, where he worked for four and a half years as a Regional Consultant. He received his MBA in Quantitative Finance, Accounting, and Economics from NYU’s Stern School of Business in 2010, and he received his bachelor’s degree from Colgate University in Economics in 2006. Christopher is a holder of the Chartered Financial Analyst Designation.