

(Not) Over the Hedge
Published November 15, 2022

Research Analyst
It’s been a turbulent year for European markets.
The aftershocks of the Russian invasion of Ukraine further inflamed economic conditions already strained by inflationary pressures and rising interest rates.
The euro and the U.S. dollar hit parity for the first time in two decades in July. The last time markets had seen such a phenomenon was in December 2002, just three years after the euro made its debut. As of October 24, one U.S. dollar could buy 1.01 euros.
Despite worldwide inflation, Americans are flying across the pond in record numbers, eager to participate in what almost feels like a fire sale across the entire region. Holiday-goers aside, exporters are also poised to take advantage of a tumultuous FX landscape that has made euro-denominated goods more attractive for overseas buyers.
In a sign of potential FX tailwinds for exporters, we have begun to see a modest performance gap materializing between the MSCI EMU (European Economic and Monetary Union) Automobiles Index and the broader MSCI EMU Index in the past few months.
Year-to-Date Performance, MSCI EMU vs. MSCI EMU Automobiles
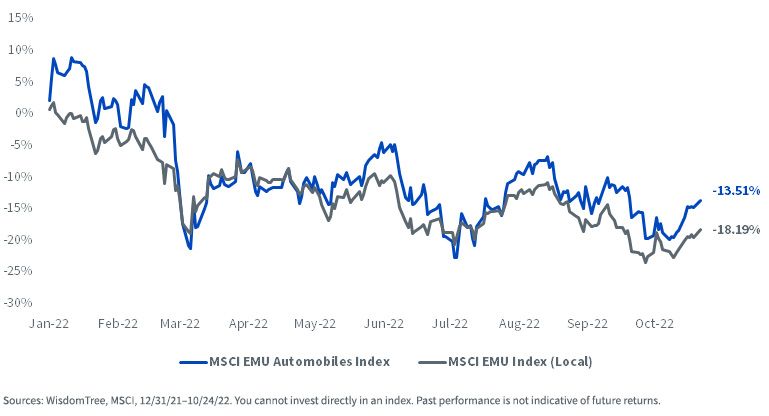
For definitions of indices in the chart above, please visit the glossary.
WisdomTree Europe Hedged Equity Index Rebalance
The WisdomTree Europe Hedged Equity Index (WTEHIP) conducted its annual rebalance at the beginning of November.
The Index seeks to provide exposure to European equities while mitigating exposure to fluctuations of the euro relative to the U.S. dollar. The Index is based on dividend-paying companies in the WisdomTree International Equity Index that are domiciled in Europe and are traded in euros, have at least $1 billion market capitalization and derive at least 50% of their revenue in the latest fiscal year from countries outside of Europe, essentially tilting holdings toward exporters.
Year-to-Date, WisdomTree Europe Hedged Equity vs. MSCI EMU
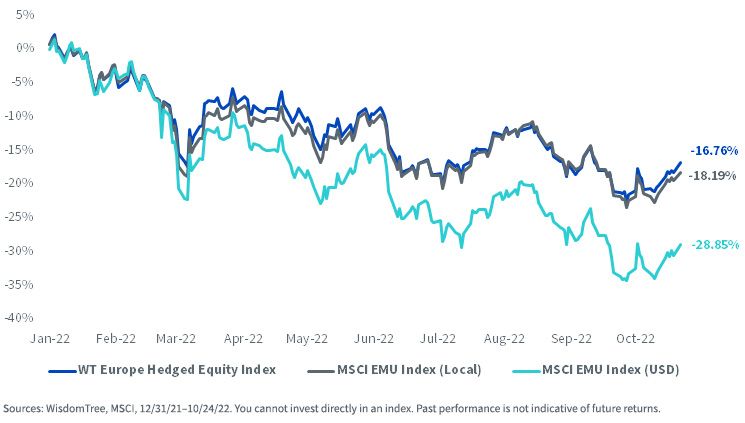
The rebalance saw the Index make major additions in the Consumer Discretionary sector and drop significant allocations in the Industrials and Materials sectors.
Rebalance Changes, Sector Weights
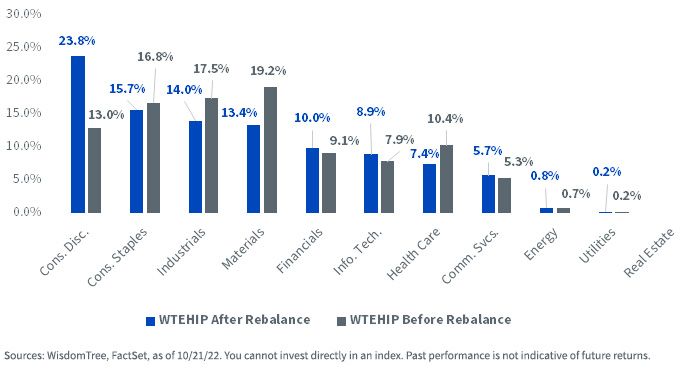
These sector weight changes were largely due to the performance of exporters of luxury goods, such as automobiles, that increased their distributions over the past few months. The rebalance bumped two names into the Index’s top 10 holdings: Mercedes-Benz Group AG and Bayerische Motoren Werke AG (BMW)—both German automakers.
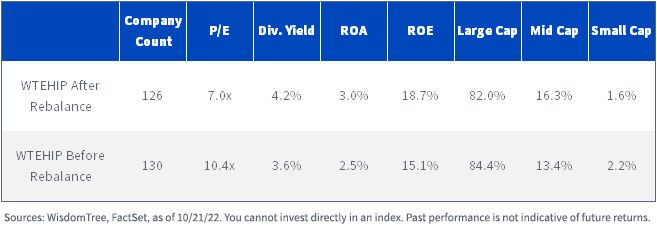
Looking at the effect of the rebalance on portfolio fundamentals, WTEHIP modestly improved its return on assets and return on equity. It also reduced its price-to-earnings ratio from 10.42x to 7.03x and improved its dividend yield from 3.56% to 4.22%. Index constituents were roughly unchanged, decreasing from 130 securities to 126 securities after the rebalance.
Rebalance Changes, Index Characteristics
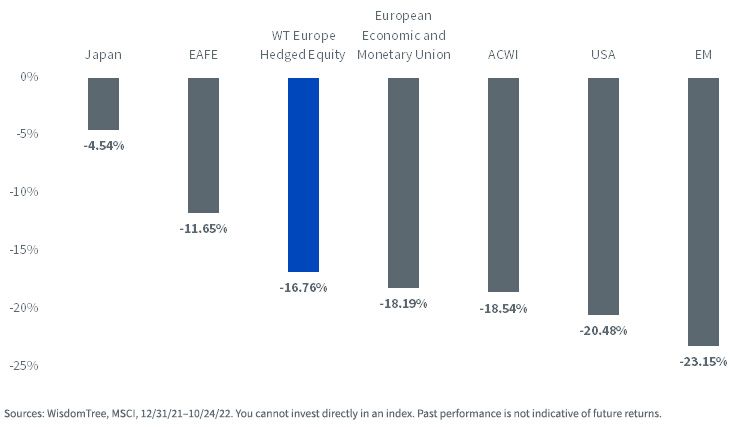
What may be surprising to some investors is that European equities—despite all the geopolitical and economic turmoil of 2022—have slightly edged U.S. equities in local currency terms.
European exporters (as measured by the WisdomTree Europe Hedged Equity Index) have fared even better, benefiting from a more competitive euro, and were able to mitigate exposure to the global sell-off in high-growth stocks.
Year-to-Date Index Performance, WisdomTree Europe Hedged Equity vs. MSCI Indexes
As the popular saying goes, “Things get worse before they get better.” On the economic front, valuations of European equities certainly look discounted to reflect that sentiment.
The trailing 12-month price-to-earnings ratio of around 10x for European equities is as depressed as we have seen for the market over the past 10 years—a decade that included myriad challenges to the existence of the euro altogether.
Lowest P/E Ratio Since Index Launch
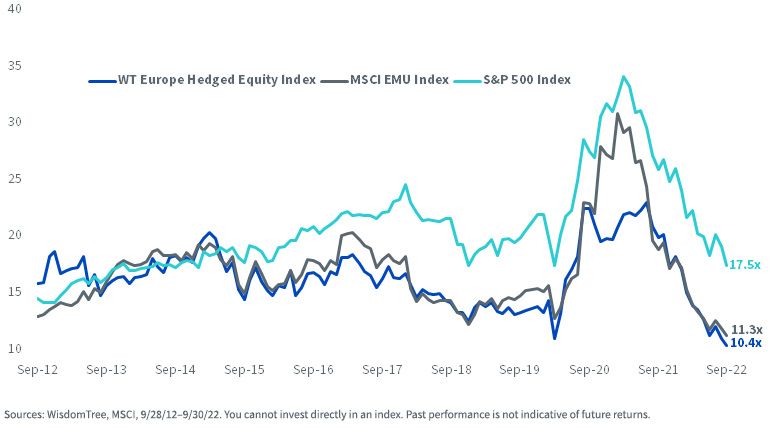
The gap between the price-to-earnings ratios of the S&P 500 and the MSCI EMU Index has been widening since an initial convergence in 2020.
For perspective, the median absolute difference between the S&P 500’s price-to-earnings ratio and that of the MSCI EMU Index from September 2002 to September 2012 was 2.6 multiple turns.
That median difference from September 2012 to today is now 3.8 multiple turns—almost 50% wider.
As of November 11, 2022, WTEHIP held 3.80% and 3.10% in Mercedes-Benz AG (MBG GY) and Bayerische Motoren Werke Ag (BMW GR), respectively. Click here for a full list of holdings. Holdings are subject to change.
Categories
About the contributor

Research Analyst
Hyun Kang joined WisdomTree in July 2022 as a Research Analyst. As a part of the Index team, he assists with the creation and maintenance of the firm’s indexes and supports the group’s research initiatives across various strategies. Hyun graduated from Carnegie Mellon University, with a B.S. in Business Administration and an additional major in Statistics and Machine Learning.