
Five and Dime


I’m going out on a limb here. Does anybody reading this remember the “five and dime” stores? No, this isn’t some nostalgic trip down memory lane or a commentary on inflation. Although, you have to admit, with prices where they currently reside, “five and dime” would be rather difficult to come by. Nonetheless, the “five and dime” reference in this blog post is referring to recent action within the U.S. Treasury (UST) 5- and 10-Year notes.
It goes without saying that when investors want to know how the “bond market” did on any given day, typically the response is given in the context of whatever the UST 10-Year note did on that day. However, when one focuses exclusively on this maturity, there can be other noteworthy developments that are occurring on the rate front that could go unnoticed. That is where the UST 5-Year note comes into play.
U.S. Treasury Yields
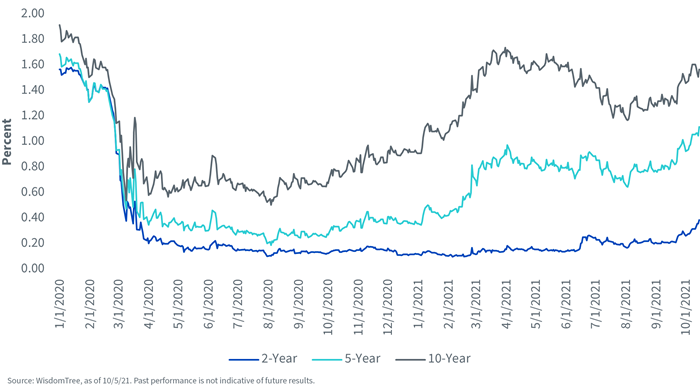
The above graph highlights developments for both the UST 5- and 10-Year notes, and I threw in the 2-Year for good measure. As we wrote in last week’s blog post, the UST 10-Year yield has seen a rather visible increase since August, with a good portion of the rise occurring just within the last few weeks. For the 5-Year, the yield increase has been just about 50 basis points (bps) during this same timeframe, with almost three-quarters of its rise also occurring since mid-September. However, there is an important distinction to be made between these two developments. The upward move in the UST 5-Year yield has taken the level back to where it was in February 2020, or pre-pandemic, while the UST 10-Year yield is still residing below the recent high watermark printed on March 31. In the past, the 5-Year sector has been viewed as the fulcrum of the Treasury yield curve and oftentimes provided a signal as to where the collective market believes rates are headed.
Now, I didn’t throw in the UST 2-Year yield just by accident. Obviously, the rise here has been a bit more moderate at only a little more than 20 bps during the period under review, but once again, let’s take a look at the absolute level. In this case, the reading of just under 0.40% (as of this writing), puts the UST 2-Year yield at right about where it was when the Fed engineered its second COVID-19-related rate cut of 100 bps in March of last year, which brought Fed Funds into their current zero interest rate policy (ZIRP).
Conclusion
So, is the UST market trying to tell us something? In my opinion, if this latest trend is any indication, the market may be gearing up for a more sustainable rise in rates as compared to earlier this year.
Share & Comment
Popular Posts
Categories
Related Links