

Japan: Opening Up the Playbook
Published April 29, 2021

Matt Wagner, CFA
Director, Research
Investors who withstood last spring’s volatility have a good problem to solve for.
S&P 500 returns since its March 23, 2020, low have been remarkable—over 90%. But with this head-spinning rebound have come unattractive valuations. Multiples have expanded from 13 times forward 12-month earnings last March to over 23 times forward 12-month earnings today.
With valuations on the S&P 500 the highest they have been since the early 2000s, investors may want to consider “opening up the playbook”—reducing a home country bias toward large-cap U.S. equities in favor of allocations toward more moderately valued international equities.
Headwinds Bring Opportunity
Arguably no market has been more unloved by international investors in recent years than Japan. There are a few theories as to why:
- Sector composition: A lack of domestic tech mega caps in favor of cyclical sectors—like Autos and Banks—has been a headwind for Japanese indexes during a global rally in growth stocks
- Policy mistakes: A government that has made a handful of policy missteps, particularly with consumption tax hikes in 2014 and 2019
- Aging population: Demography is destiny, or so it is said. There has been fear that an aging population in Japan will put a lid on the country’s long-term growth potential, coupled with chronically low equity investment from a notoriously conservative domestic investor base
Most recently, a surge in coronavirus cases has added to near-term economic uncertainty. Several of Japan’s largest cities recently enacted a lockdown for the next several weeks—coinciding with the Golden Week holidays—to curb the virus. Unsurprisingly, the lockdowns have dented Japanese equity returns over the past week.
Cumulative Foreign Net Equity Investment (¥ Bn)
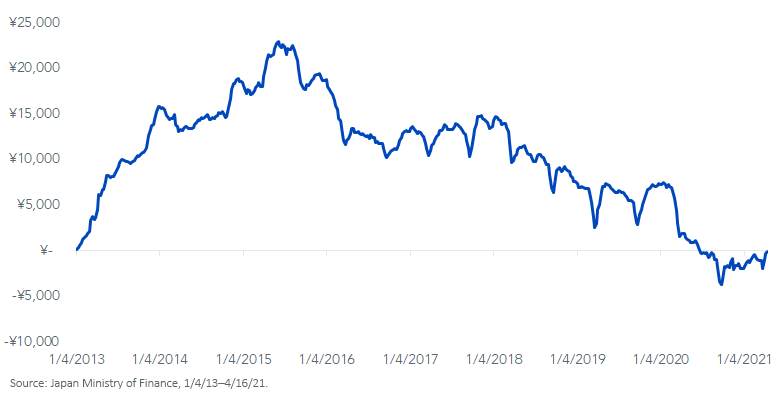
In part as a byproduct of low international investor interest, Japanese equities are significantly discounted relative to the U.S., and have a much lower valuation relative to its own history than most other major markets.
These valuations are what attracted Warren Buffett to initiate a 5% stake in five Japanese trading houses in August of last year.
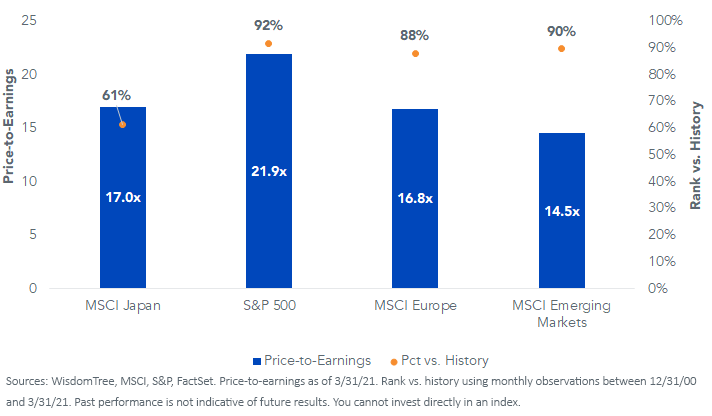
To compare current valuations relative to history, the below chart shows the current price to earnings (P/E) ratio (blue bars) of each MSCI regional index alongside the S&P 500 with a percent rank comparison to how each market is priced relative to its own history (orange dots).
A rank of 61% for the MSCI Japan Index indicates that the Japanese market is at a premium relative to its historical P/E ratio as it is above its historical median (the 50th percentile). The S&P 500 is trading at the highest level relative to its history as its current P/E is in the 92nd percentile.
Current Valuations vs. History (12/31/00–3/31/21)
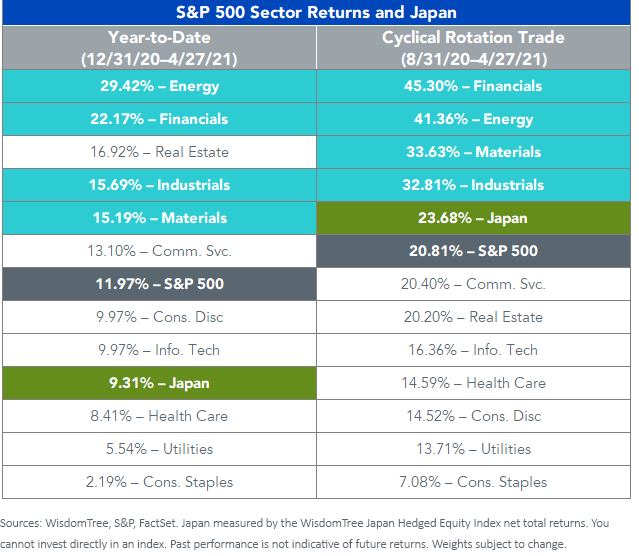
While Japan’s position as a market more tilted to cyclical sectors was a headwind during a global rally in growth stocks, it may be perfectly primed for an environment in which economic growth is expected to make a significant recovery in the coming years.
For example, WisdomTree’s Japan Hedged Equity Index—which tilts more toward cyclical sectors than the broad MSCI Japan Index and neutralizes yen fluctuations—has outperformed the S&P 500 by nearly 300 basis points since the end of August. The recently enacted lockdowns have been a headwind to year-to-date returns.
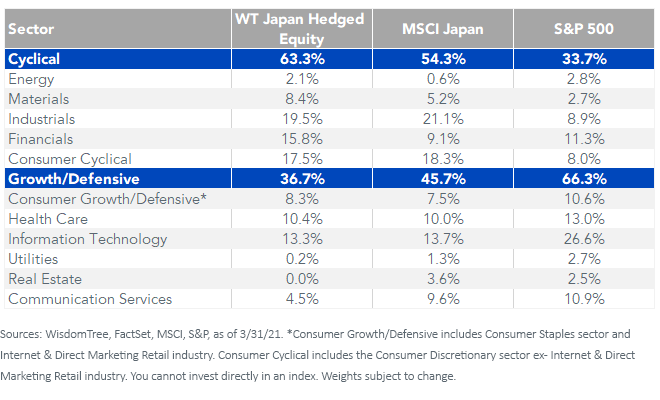
Japan for Cyclical Rotation
The S&P 500 only has about a 34% weight in the cyclical sectors most likely to benefit from an accelerating economy. The WisdomTree Japan Hedged Equity Index has almost twice as much weight and nearly 10% more than the MSCI Japan Index.
Index Sector Weights
The S&P 500 is up more than 11% to start the year despite concerns over rising interest rates. Nonetheless, the potential for higher rates becoming a headwind to both fixed income and equity returns remains a top concern among asset allocators.
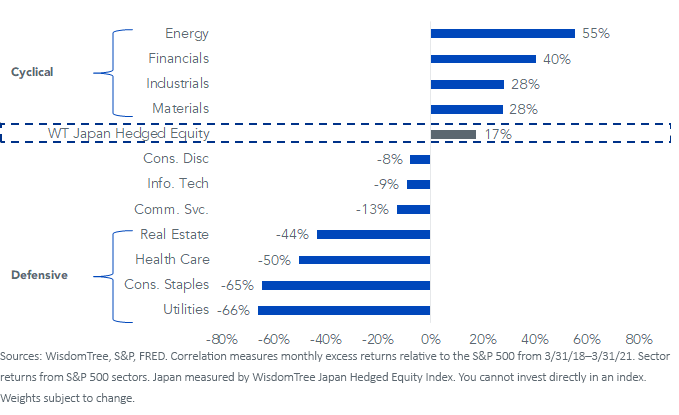
Given the cyclical tilts of the Japanese equity market, as well as the tendency for the yen to weaken alongside a rise in U.S. rates, the WisdomTree Japan Hedged Equity Index has had a positive correlation between its outperformance and rising Treasury yields.
Trailing 3-Year Correlation: Excess Returns vs. 10-Year U.S. Treasury Yield
Conclusion: Follow Buffet’s Playbook
The steady and reliable earnings growth from U.S. mega caps powered U.S. indexes higher over the past several years. With U.S. valuations now near two-decade highs and the potential for a synchronized global recovery on the horizon, investors may want to consider Buffett’s “Buy Japan” playbook.
Categories
Related articles

DXJ at 20: The ETF That Separated Japan from the Yen
It's Good to Be #1
Japan Is Back

From Trading Houses to Tokio Marine: Buffett’s Expanding Bet on Japan

A Playbook for the Currency Opportunity in Today’s Market

Tariffs Are (Sort of) Done: What the Supreme Court Ruling Means for Markets
Japan’s Moment: Elections, Flows & Global Opportunities
An Update on the Japan Opportunities
The Power of Hedging in a Year of Yen Swings
About the contributor

Matt Wagner, CFA
Director, Research
Matt Wagner joined WisdomTree in May 2017 as an Analyst on the Research team. He currently serves as a Director, where he supports the creation, maintenance, and reconstitution of WisdomTree’s indexes and actively managed ETFs. Matt began his career at Morgan Stanley, working as an analyst in Treasury Capital Markets from 2015 to 2017, focusing on unsecured funding planning, execution, and risk management. He graduated magna cum laude from Boston College in 2015 with a B.A. in International Studies, concentrating in Economics. In 2020, he earned a Certificate in Advanced Valuation from NYU Stern. He is also a Chartered Financial Analyst (CFA) charterholder.