
The Declining Quality of Small Caps


The outperformance of higher-quality small caps relative to lower-quality companies has been well documented, notably in AQR’s 2015 paper, “Size Matters, If You Control Your Junk.”
The intuition behind this anomaly is straightforward: Lower-quality small caps have less capacity to distribute earnings to shareholders or invest for growth, are more likely to issue shares and, in a worst-case scenario, are more likely to go bankrupt.
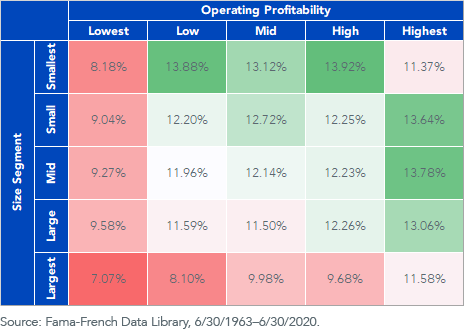
The table below shows the performance of 25 portfolios ranked by size and operating profitability (i.e., quality) from the Fama-French Data Library back to 1963. Among the small and smallest portfolios (top two rows), there is significant underperformance for the lowest operating profitability portfolios relative to the other portfolios in their respective size segments.
Fama-French U.S. 5 x 5 Portfolios: Size x Operating Profitability
Performance Across Cycles
This long-run outperformance is compelling, but it doesn’t capture which market regimes are most conducive to small-quality outperformance.
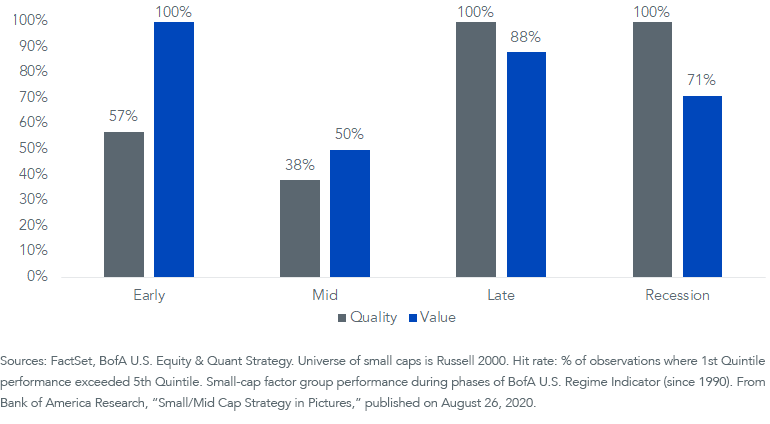
According to Bank of America Research, high-quality small caps have outperformed low-quality small caps 100% of the time in late-cycle and recession phases over each observation since 1990. Small value, on the other hand, has had its most consistent outperformance in the early stages of an economic cycle.
Small-Cap Quintiles
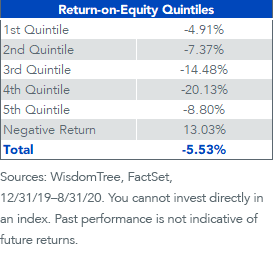
During the current coronavirus-induced recession, high-quality small caps have severely lagged low quality. The outperformers in 2020 have been unprofitable tech and biotech stocks.
Companies with negative return on equity (ROE) have returned 13.03% this year, while the highest ROE quintile has returned -4.91%—albeit still a positive spread of nearly 400 basis points (bps) between the most profitable and least profitable firms when looking at the 1st Quintile versus 5th Quintile.
Russell 2000 Index
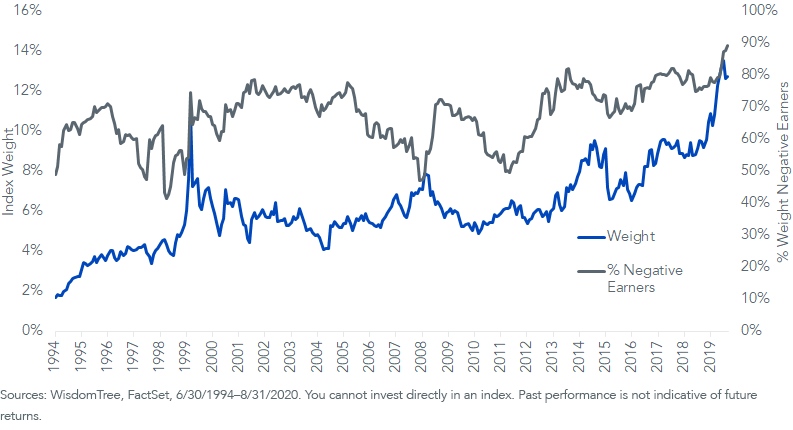
Increasing Market-Cap Weights of Negative Earners
The growing importance of negative earners in small-cap indexes has helped propel leverage ratios to all-time highs for the Russell 2000. The highly speculative Pharmaceuticals, Biotechnology, & Life Sciences Industry Group now occupies 13% of the Index, and 90% of the weight in this industry group is in negative-earnings companies—an all-time high.
Russell 2000 – Pharmaceuticals, Biotechnology, & Life Sciences Industry Group
As an increasing percentage of negative earnings growth companies occupy greater weight in the broad Russell 2000 Index benchmark, we advocate for investors to consider adding a quality filter to small-cap allocations.
Low interest rates tend to favor growth-oriented companies—where far out future profitability looks more attractive on discounted cash flow valuations—but the outperformance of unprofitable growth companies seems to be at an unsustainable extreme.
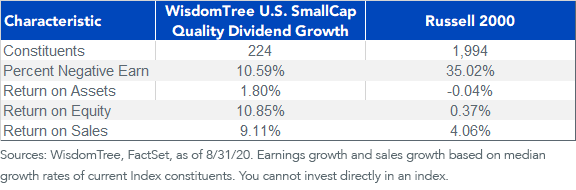
The WisdomTree U.S. SmallCap Quality Dividend Growth Index selects dividend-paying small caps with high profitability and growth characteristics. This approach significantly mitigates the exposure to negative earners and improves aggregate profitability characteristics.
Index Quality Characteristics
Cyclical Recovery
Equities’ recovery from their March lows has been extraordinary. But, as always, the recovery has been uneven.
The winners have been some of the high-growth small caps alongside the FAANG mega caps. This stellar outperformance from the largest companies has led the S&P 500 Index valuations to hit levels unseen since the tech bubble.
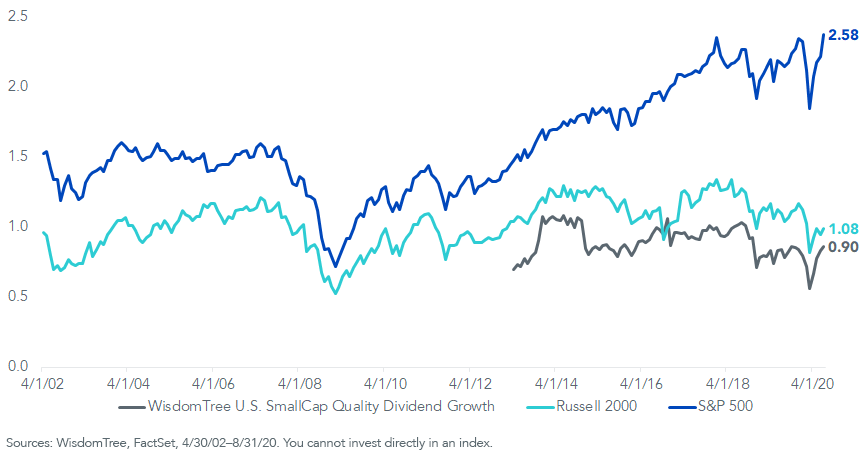
The 2.6 price-to-sales ratio for the S&P 500 Index is its highest level since 2002. This compares to a ratio of 1.08x for the Russell 2000 Index, which is far off its high of 1.34x last reached in mid-2018.
The WisdomTree U.S. SmallCap Quality Dividend Growth Index provides an even greater valuation discount, at just 0.90x sales.
For investors looking for multiple expansion during a cyclical recovery, small-cap quality looks far better positioned than both large caps and the broad-based Russell 2000 Index.
Index Price to Sales Ratio
Share & Comment
Popular Posts
Categories
Related Links