
A Core Strategy with Value Prices


It’s not easy being a value investor these days.
For several years, market gains have been concentrated in technology and mega-cap growth. Anything without large weights to the FAANG1 stocks has lagged miserably.
Over the last three years, the Russell 1000 Value Index lagged the S&P 500 Index by over 900 basis points (bps) per year.2
It’s … staggering.
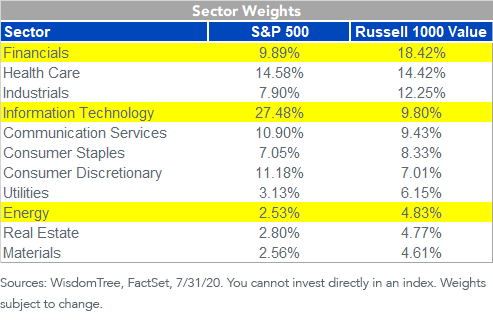
Sector Bets Are a Key Factor in This Gap
Financials have almost twice as much weight in the Russell 1000 Value as in the S&P 500. Information technology, the big market leader, is about 10% of the Russell 1000 Value versus over 25% of the S&P 500.
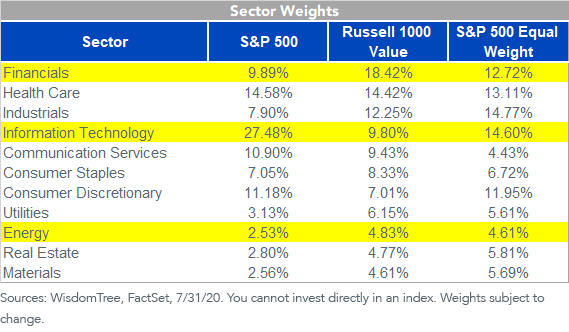
Even if you look at the S&P 500 Equal Weight Index, it has lagged the market cap-weighted S&P 500 Index by about 5% per year over the last three years.3
Which is interesting, because equal weighting has historically been an effective strategy.
Over the long term, equal-weighted indexes have outperformed cap-weighted indexes, according to Fama-French data.
On a rolling three-year basis, the U.S. market equal-weighted strategies had a median excess return of 25 bps annualized. On a rolling 10-year basis, the median excess return was 70 bps annualized.4
Equal weighting the S&P 500 also leans toward value-factor benchmarks, unfortunately. The weights are not as extreme as the Russell 1000 Value. But part of the reason the equal-weighted index has lagged is due to its higher weighting in financials and energy, and lower weights in technology.
Call us crazy, but we believe valuation matters to long-term returns, and concentration at the top of the index cannot continue forever.
But if you’re afraid of the high-multiple market leaders, do you have to accept these sector and factor bets to move away from cap weighting?
We think there could be a better solution.
WisdomTree created our multifactor strategy—the WisdomTree U.S. Multifactor Fund (USMF)—to offer exposure to multiple factors:
- Yes, value—by judging stocks within each industry on six valuation metrics, most of which are earnings-based, we try to avoid the sector biases of traditional value strategies.
- On the opposite side of value, we look at quality ratios like return on equity (ROE), return on assets and the trend change in these variables to get stocks with increasing earnings. This is also done within industries.
- We also look at momentum, which we apply on a risk-adjusted basis that helps to avoid ”value traps.”
- We added a diversifying factor called the low-correlation factor that looks for stocks that are less sensitive to the overall market averages. During a volatile year, this should be a helpful factor.
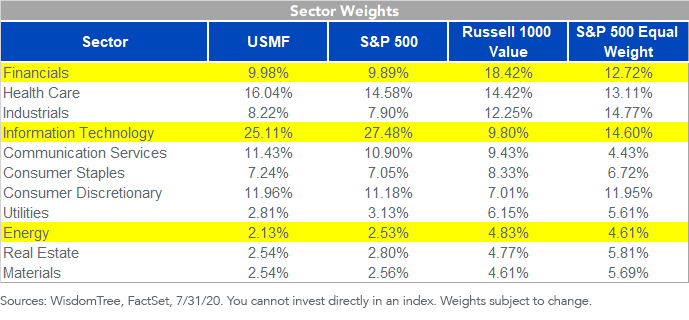
Valuations of this multifactor strategy today display a value tilt similar to that of a traditional value index, but the strategy achieves those “low prices” while being sector-neutral to the market.
The Russell 1000 Value currently has a ROE of only 10%, compared to nearly 14% for the S&P 500, justifying its lower average P/E ratio. Notably, USMF currently has a lower P/E ratio than the Russell 1000 Value but a 90% higher ROE, and a higher ROE than the market.
This is a unique combination of factor diversification.
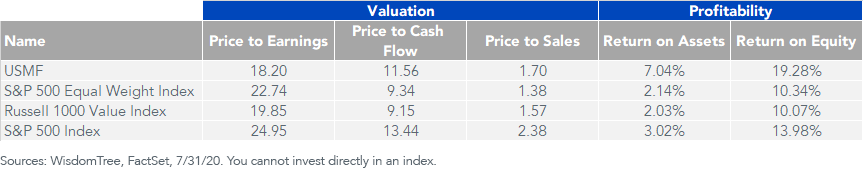
For definitions of terms in the chart, please visit our glossary.
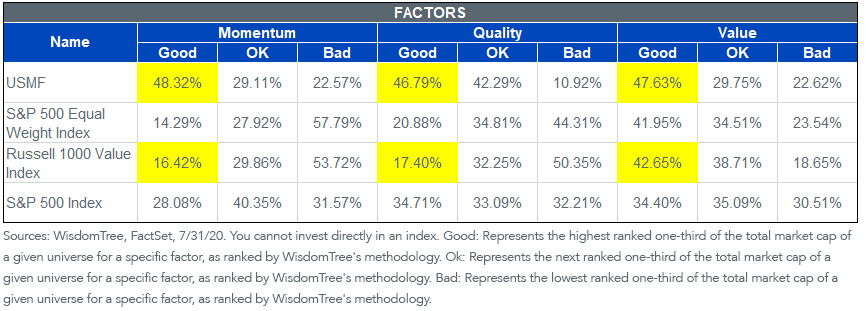
While you can see these factor tilts in the underlying P/E multiples and ROE figures, our factor grid below shows how much of each strategy’s weight is allocated to these various factors.
- USMF actually had more value exposure than the Russell 1000 Value, and over two times as much exposure to high-quality stocks.
- While a value index generally has exposure to ”poor momentum stocks,” USMF had more balanced momentum exposure, because the factor is one of its stock selection criteria.
The weighting process of this multifactor strategy has a factor and risk weighting that gives it an equal-weighted experience.
Looking forward, given our view that the weights of the top-five stocks by market cap could be hard to sustain, USMF is a strategy that can help manage valuation risk without betting big against any sector or specific low-quality tilt.
Cumulative Performance since USMF Inception
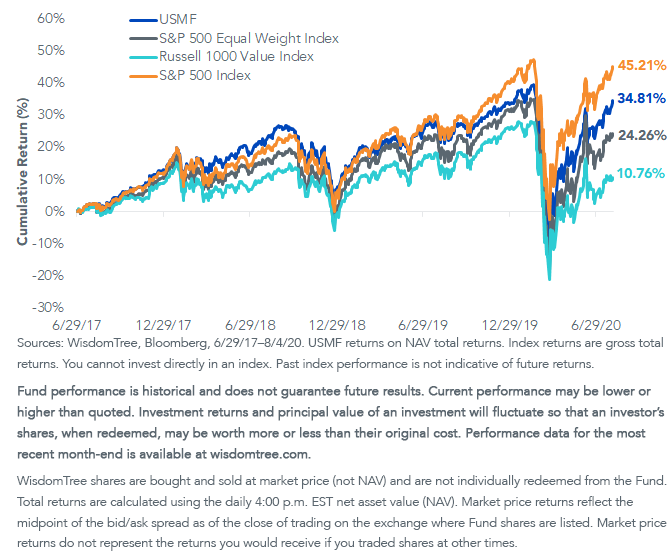
Fund performance is historical and does not guarantee future results. Current performance may be lower or higher than quoted. Investment returns and principal value of an investment will fluctuate so that an investor’s shares, when redeemed, may be worth more or less than their original cost. Performance data for the most recent month-end is available at wisdomtree.com.
WisdomTree shares are bought and sold at market price (not NAV) and are not individually redeemed from the Fund. Total returns are calculated using the daily 4:00 p.m. EST net asset value (NAV). Market price returns reflect the midpoint of the bid/ask spread as of the close of trading on the exchange where Fund shares are listed. Market price returns do not represent the returns you would receive if you traded shares at other times.
For standardized performance of USMF, please click here.
1As of 7/29/20, the WisdomTree U.S. Multifactor Fund (USMF) held Facebook (0.70% weight), Amazon (0.83%) and Netflix (0.81%).
2Source: Bloomberg, 8/4/17-8/4/20.
3Source: Bloomberg, 8/4/17-8/4/20.
4Source: Kenneth French Data Library, 12/31/1926–12/31/2019. Based on annual observations.
Important Risks Related to this Article
There are risks associated with investing, including the possible loss of principal. Investing in a Fund exposed to particular sectors increases the vulnerability to any single economic, political or regulatory development. This may result in greater share price volatility. Due to the investment strategy of the Fund, it may make higher capital gain distributions than other ETFs. Please read the Fund’s prospectus for specific details regarding the Fund’s risk profile.
Diversification does not eliminate the risk of experiencing investment losses.
References to specific securities and their issuers are for illustrative purposes only and are not intended to be, and should not be interpreted as, recommendations to purchase or sell such securities.
Share & Comment
Popular Posts
Categories
Related Links
Jeremy Schwartz has served as our Global Chief Investment Officer since November 2021 and leads WisdomTree’s investment strategy team in the construction of WisdomTree’s equity Indexes, quantitative active strategies and multi-asset Model Portfolios. Jeremy joined WisdomTree in May 2005 as a Senior Analyst, adding Deputy Director of Research to his responsibilities in February 2007. He served as Director of Research from October 2008 to October 2018 and as Global Head of Research from November 2018 to November 2021. Before joining WisdomTree, he was a head research assistant for Professor Jeremy Siegel and, in 2022, became his co-author on the sixth edition of the book Stocks for the Long Run. Jeremy is also co-author of the Financial Analysts Journal paper “What Happened to the Original Stocks in the S&P 500?” He received his B.S. in economics from The Wharton School of the University of Pennsylvania and hosts the Wharton Business Radio program Behind the Markets on SiriusXM 132. Jeremy is a member of the CFA Society of Philadelphia.