
Cratering: A Q2 GDP Experience


When the pandemic began to shut down global economies earlier this year, we all heard some rather dire forecasts for what it could mean for economic activity, especially in the second quarter. For sure, Q1 GDP statistics were already revealing negative performances, sending an ominous signal that the worst was yet to come. Unfortunately, the prognostications proved to be accurate, and Q2 produced record-breaking contractions in GDP both in the U.S. and on the other side of the Atlantic. With U.S. and eurozone economies cratering, the natural question is what comes next?
Before we can even think about Q3, let’s do a quick review of Q2. Statistically speaking, there are some differences to how U.S. and eurozone GDP is calculated, but I won’t go down that rabbit hole. Let’s keep it simple—the U.S. quarter on quarter (QOQ) calculation is annualized, whereas the eurozone’s is not.
Global GDP—Q2 2020
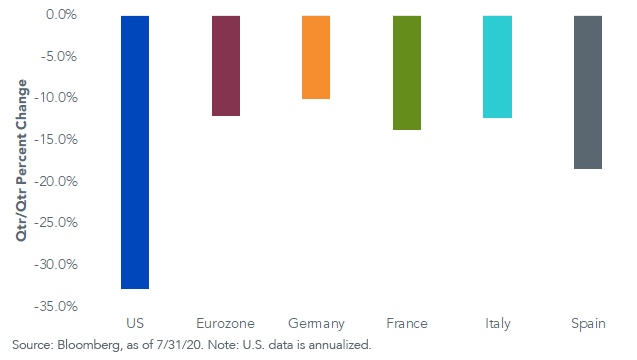
OK, with that fun fact out of the way, let’s go to the numbers. U.S. real GDP has the ignominious distinction of having the largest absolute negative reading, at -32.9% (-9.5% on a pure QOQ basis). For the eurozone as a whole, the contraction was -12.1%, led by Spain (-18.5%), France (-13.8%) and Italy (-12.4%). Germany did not escape a double-digit negative performance (-10.1%), but it had the smallest contraction.
With respect to the eurozone, there is some divergence between Germany, and Spain and Italy. Those two southern countries are key tourist destinations, so this development should not be all that surprising. That industry was arguably the hardest hit not just there, but on this side of the Atlantic as well.
In the U.S., personal consumption was down -34.6%, with services leading the way at -43.5%. Investment wasn’t much better, with nonresidential and residential outlays down -27.0% and -38.7%, respectively. What about all that fiscal stimulus, you ask? Total government spending was up 2.7% but held in check by contraction at the state and local level.
Conclusion
Graphically speaking, it appears Q3 GDP numbers could be set for another V-shaped outcome. However, our ‘it feels more like a U-shaped recovery’ thesis remains the more reasonable case scenario. That being said, we can hope that we’re not gearing up for the ‘W’.
Here in the U.S., early Q3 real GDP estimates range from roughly +10% to +20%, which could produce a record-setting performance, in a good way. Unfortunately, the crater is so deep that even if growth does show this type of projected rebound, the economy still has a long way to go to get back to pre-pandemic levels.
Unless otherwise stated, data source is Bloomberg, as of 7/31/20.
Share & Comment
Popular Posts
Categories
Related Links