
The Undervalued Value Factor
Published February 24, 2020

Associate, Research
Is value investing dead?
After a decade of underperformance, investors aren’t wrong for asking.
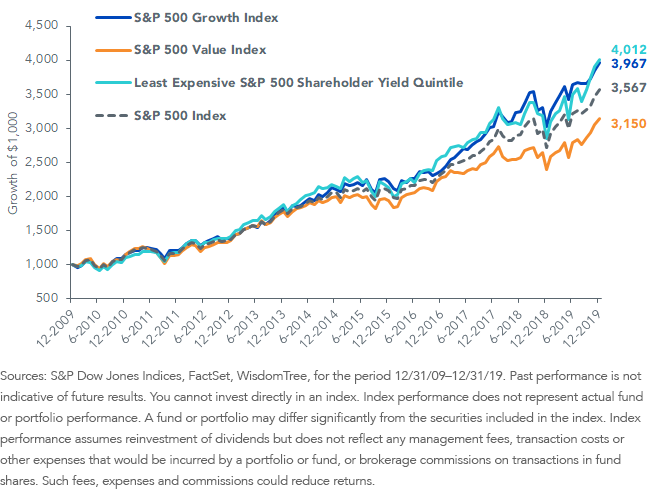
In the last 10 years the S&P 500 Growth Index has returned 14.8% annually, while the S&P 500 Value Index returned 12.2%.1
Closing a 260 basis points (bps) annual return deficit is no small feat—but don’t throw in the towel on value just yet.
Shareholder yield, the ratio of capital returned through dividends and buybacks relative to share price, is a measure of value that kept up with the S&P 500 Growth Index over the last decade.
Companies with the highest shareholder yield returned 14.9% annually between 2010 and 2019.2
Figure 1: Growth of $1,000 (12/31/09–12/31/19)
Last year we wrote about shareholder yield being a more effective measure of value than price-to-earnings (P/E) or price-to-book (P/B) ratios.
If you believe in value investing, you expect the least expensive stocks to outperform both the 1) most expensive stocks and 2) benchmark:
- Returns for the highest shareholder yield (lowest valuation) stocks beat the most expensive by 570 bps annually over the last 10 years.3 For price-to-book and price-to-earnings value ratios, the least expensive failed to outperform the most expensive.4
- Relative to other measures of value, the highest shareholder yield stocks delivered the greatest outperformance (+134 bps annually) versus the S&P 500 Index. The least expensive price-to-earnings stocks slightly beat the benchmark (+26 bps annually), and the least expensive price-to-book stocks lagged (-193 bps annually).5
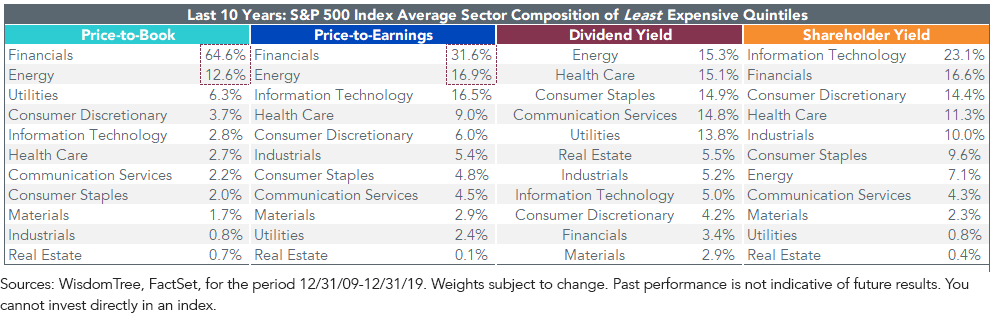
Part of the reason that shareholder yield has proven to be an effective value measure is because of sector exposures.
The least expensive subsets on price-to-book and price-to-earnings have loaded approximately 50%–75% of their weight in the Energy and Financials sectors. Meanwhile, shareholder yield has benefited from more diverse sector exposure and an overweight allocation to Information Technology, the strongest performing sector of the 2010s.6
Notably, the least expensive shareholder yield quintile has the lowest active weight versus the S&P 500. This means that sector weights in this subset most closely resemble that of the broad market benchmark.
Figure 2: Sector Exposures
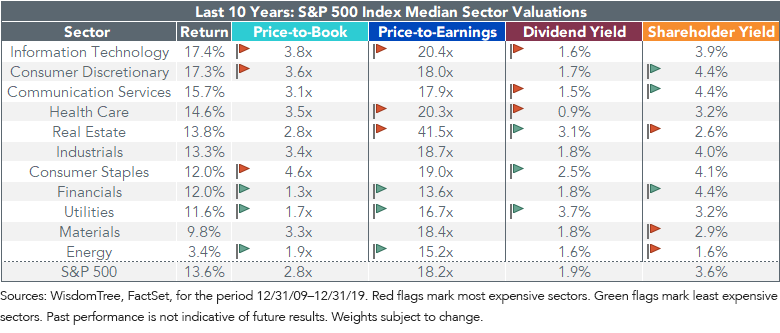
Sectors that have screened expensive on P/B or P/E have been more attractively valued based on shareholder yield (figure 3). These sectors, which include Information Technology and Consumer Discretionary, have delivered above-benchmark returns over the last decade.
Figure 3: Median Sector Valuations
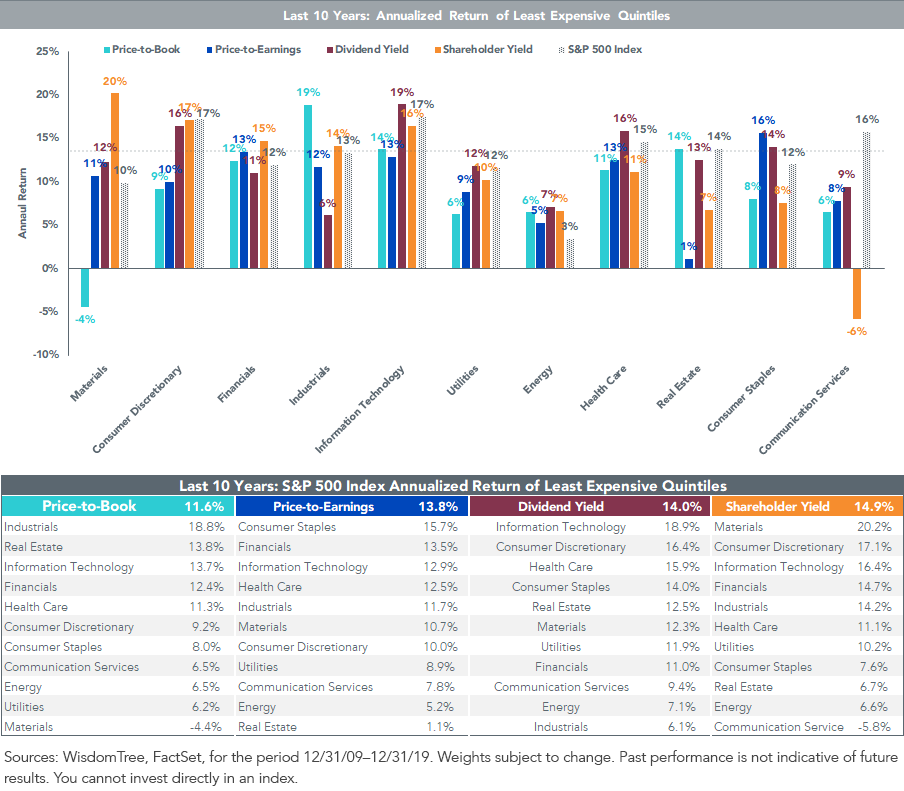
As a value factor, shareholder yield has generated the greatest outperformance relative to P/B and P/E in the Materials and Consumer Discretionary sectors (figure 4). It has also been very effective within Information Technology and Financials.
It’s important to acknowledge that P/B and P/E have still been useful measures of value in certain sectors. Screening for low price-to-book companies in Industrials and Real Estate worked well during the last 10 years. Low price-to-earnings companies in the Consumer Staples sector delivered strong returns as well.
Interestingly, high shareholder yield companies within Communication Services were a substantial headwind on the return for the factor. All measures of value lagged the benchmark within this sector, which brings into question whether a value strategy works at all in Communication Services.
Figure 4: Sector Returns
Adding a Shareholder Yield Value Strategy to Your Portfolio
The highest shareholder yield subset of the S&P 500 not only generated returns above the low P/E and P/B subsets, but it also outperformed the broad benchmark and its growth counterpart while maintaining sector diversity.
Value isn’t dead.
The WisdomTree U.S. Quality Shareholder Yield Fund (QSY) is a quantitative active strategy that combines a methodical approach to ranking stocks on their shareholder yield and quality scores, with the added ability to apply discretion where risks or opportunities to the quantitative model are present.
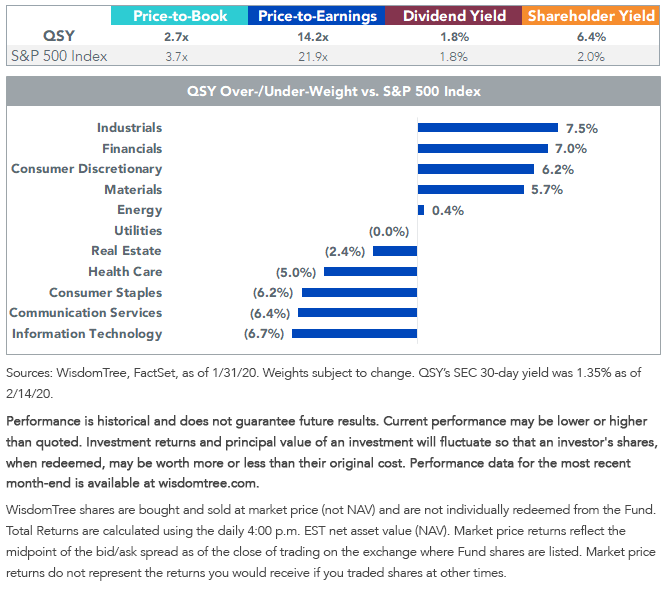
QSY is currently valued at a steep discount to the S&P 500 on both P/B and P/E, and it offers more than triple the shareholder yield of the benchmark index.
Figure 5: QSY Characteristics
For standardized performance of QSY, please click here.
After a decade of traditional value underperformance, we’ve seen that companies returning the most capital through dividends and buybacks can create value for shareholders in the form of excess returns. Looking ahead to the 2020s, QSY may be a solution for valuation-sensitive investors seeking exposure to high shareholder yield companies.
1Source: S&P Dow Jones Indices. As measured by the S&P 500 Growth Index and S&P 500 Value Index for the period 12/31/09–12/31/19.
2Sources WisdomTree, FactSet. As measured by companies in the S&P 500 with a shareholder yield ratio ranking the top 20th percentile of their corresponding regional and size grouping for the period 12/31/09–12/31/19.
3Sources: WisdomTree, FactSet. As measured by the difference in returns between the companies in the S&P 500 with a shareholder yield ratio ranking in the top and bottom 20th percentile of their corresponding regional and size grouping. For the period 12/31/09–12/31/19, the top and bottom quintiles returned 14.9% and 9.2% annualized, respectively.
4Sources: WisdomTree, FactSet. As measured by the difference in returns between the companies in the S&P 500 with a price-to-book ratio and price-to-earnings ratio ranking in the bottom and top 20th percentile of their corresponding regional and size grouping. For the period 12/31/09–12/31/19, the bottom and top price-to-book quintiles returned 11.6% and 17.2% annualized, respectively; the bottom and top price-to-earnings quintiles returned 13.8% and 14.8% annualized, respectively.
5Sources: WisdomTree, FactSet. As measured by the returns of companies in the S&P 500 with a shareholder yield ranking in the top 20th percentile and a price-to-book and price-to-earnings ratio in the bottom 20th percentile of their corresponding regional and size grouping versus the returns of the S&P 500 Index. For the period 12/31/09–12/31/19, the top shareholder yield, bottom price-to-book and bottom price-to-earnings quintiles returned 14.9%, 11.6%,and 13.8% annualized, respectively, versus 13.6% annualized for the S&P 500 Index.
6Sources: WisdomTree, FactSet. For the period 12/31/09–12/31/19, the Information Technology sector returned 17.4% annualized.
Important Risks Related to this Article
There are risks associated with investing, including possible loss of principal. Funds focusing their investments on certain sectors increase their vulnerability to any single economic or regulatory development. This may result in greater share price volatility. While the Fund is actively managed, the Fund’s investment process is expected to be heavily dependent on quantitative models, and the models may not perform as intended. Please read the Fund’s prospectus for specific details regarding the Fund’s risk profile.
Categories
About the contributor
