
The Buffett Balance


Last year we wrote about the type of stocks that legendary investor and CEO of Berkshire Hathaway (BRK) Warren Buffet looks for.1
In short, Buffett prefers quality companies—high profitability without excessive leverage—that trade at reasonable valuations.
Through year-to-date September 2019, Berkshire generated an approximate 23%2 unrealized gain on the value of its equity portfolio. Although the company has yet to report full-year results, we anticipate that strong U.S. equity performance in 4Q 2019 further supported BRK’s investments.
Despite a potential banner year for BRK’s equity portfolio, the performance of Berkshire Hathaway shares lagged the S&P 500 Index by the greatest margin in a decade. Berkshire Hathaway3 shares returned 10.9% versus the S&P 500 Index return of 31.5%4.
As a conglomerate with businesses ranging from insurance to railroads, BRK’s 20.5% return deficit to the S&P 500 Index cannot be attributed to its equity portfolio. BRK’s diversified stock holdings are intended to be held long term and should be viewed as a stabilizing anchor for BRK shares when its operating businesses fall out of favor.
As admirers of Buffett’s value- and quality-centric investment philosophy, we describe the screening process in our WisdomTree U.S. Quality Shareholder Yield (QSY) and U.S. Quality Dividend Growth (DGRW) Funds as including a “Buffet factor” in stock selection.
Similar to BRK’s equity basket5, QSY and DGRW can be used to serve as anchors in investors’ U.S. equity allocation.
They say don’t meet your heroes, but they didn’t say anything about comparing yourself to them. How do DGRW and QSY stack up against BRK’s holdings?
Let’s draw comparisons from three perspectives: quality, capital return and value.
Quality
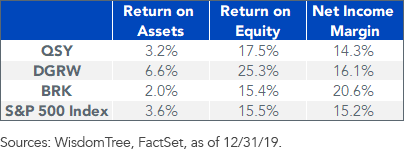
In aggregate we find that the quality screens built into DGRW’s and QSY’s methodologies are effective. The return on equity (ROE) and return on assets (ROA) quality screens, measures of company profitability, are above Berkshire’s portfolio.
Figure 1: Quality Comparison
For standardized performance of Funds in the chart, please click their respective tickers: DGRW, QSY.
For definitions of terms in the chart, please visit our glossary.
DGRW is a quality standout based on ROE and ROA, which can partially be attributed to lower exposure to the Financials sector (6% of total weight). Financials are the top sector exposure for both QSY and BRK, with Berkshire’s exposure being significantly larger (43% of total weight) than QSY’s (20%).
Figure 2: Sector Exposures
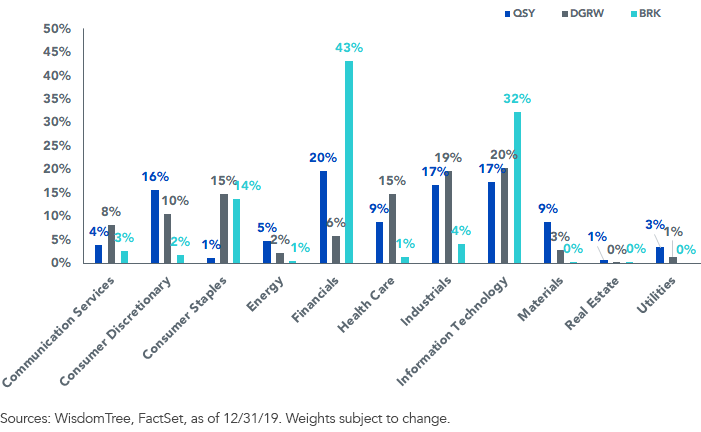
BRK’s Financials exposure is highly concentrated (27% of total weight) in large U.S. banks, including Bank of America, JP Morgan, Wells Fargo and Goldman Sachs, which on average have $2 trillion in assets. These massive balance sheets flow directly through the denominator of ROE and ROA and reduce the level of return. Apple, with $338 billion of assets, has the largest balance sheet of any company in DGRW.6
If we remove the impact the balance sheet may have on profitability and substitute revenue in the denominator, we calculate the net income margin (profit margin). We notice that BRK’s Financials exposure is now somewhat advantageous.
The average net income margin for the large banks is 20%, driving the aggregate result for BRK in figure 1. With a larger and more diverse collection of holdings, the aggregate profit margins of DGRW and QSY reflect a wider range of outcomes.
Capital Return
The funds also focus on capital return—DGRW specifically targets dividend payers, while QSY targets companies returning significant levels of capital to shareholders through both dividends and share repurchases.
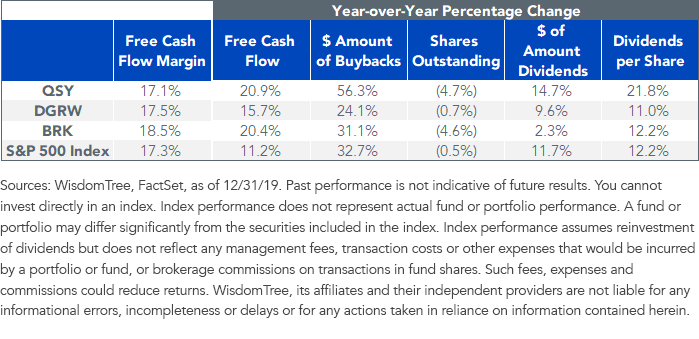
The ability to return capital to shareholders can be closely tied to other quality metrics. The free cash flow margin links profitability with potential for capital return. It measures the amount of cash flow available to shareholders for every dollar of revenue earned.
QSY, DGRW and BRK generate similar free cash flow margins, but QSY is ahead of the pack when it comes to increasing the amount of cash returned to shareholders year-over-year.
Figure 3: Capital Return Comparison
Value
Buffett would likely argue that paying a fair price for quality, capital return or any desired characteristic is the most important part of the screening process.
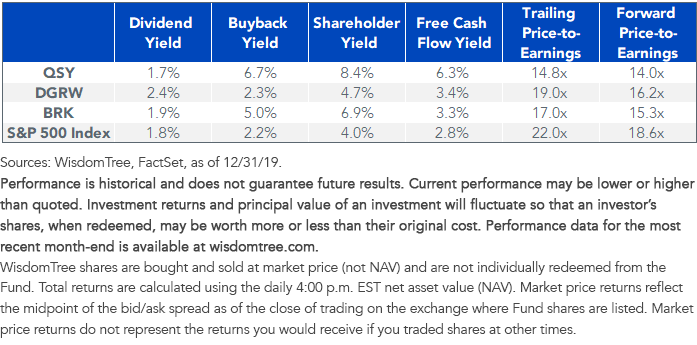
DGRW’s 2.4% dividend yield and QSY’s 8.4% shareholder yield provide a compelling investment case that strikes a balance between quality, capital return and value. QSY’s valuation looks especially discounted relative to the peer group (figure 4) with similar profitability and a high-level cash payout.
Figure 4: Value Comparison
For standardized performance of Funds in the chart, please click their respective tickers: DGRW, QSY.
For definitions of terms in the charts above, please visit our glossary.
From our analysis, we can conclude that DGRW and QSY are on par with Berkshire’s portfolio in terms of quality, capital return and value.
Importantly, these mid- and large-cap Funds achieve aggregate characteristics similar to Berkshire’s holdings without concentrated exposure to a single sector, while being valued at a discount to the S&P 500 Index.
Those investors seeking exposure to Buffet’s style of investing in a more scalable and systematic fashion should consider adding QSY and DGRW to their core U.S. equity allocations.
1As of 12/31/19, QSY and DGRW did not hold Berkshire Hathaway.
2Source: Berkshire Hathaway 10-Q filing for the period ending 9/30/19. Return measured as equity security investment gains for the first nine months of 2019 as a percentage of the fair value of equity securities as of 12/31/18.
3As measured by Berkshire Hathaway Class B Common Shares for the period 12/31/18–12/31/19.
4As measured by S&P 500 Index for the period 12/31/18–12/31/19.
5Per Berkshire Hathaway’s 13-F filing for the period ending 9/30/19. BRK’s equity portfolio consists of individual stocks, or equity securities. QSY and DGRW are exchange-traded funds (ETFs), whose shares are listed on a stock exchange and trade like equity securities at market prices. ETFs allow you to buy or sell shares that represent the collective performance of a selected group of securities.
6As of 1/31/20. DGRW held 4.6% of its weight in Apple and did not hold Bank of America, JP Morgan, Wells Fargo or Goldman Sachs. QSY held 0.8%, 0.8% and 0.6% of its weight in Apple, Bank of America and JP Morgan, respectively; QSY did not hold Wells Fargo or Goldman Sachs.
Important Risks Related to this Article
There are risks associated with investing, including possible loss of principal. Funds focusing their investments on certain sectors increase their vulnerability to any single economic or regulatory development. This may result in greater share price volatility.
While QSY is actively managed, the Fund’s investment process is expected to be heavily dependent on quantitative models, and the models may not perform as intended.
Please read each Fund’s prospectus for specific details regarding the Fund’s risk profile.
The Global Industry Classification Standard (“GICS”) was developed by and is the exclusive property and a service mark of MSCI Inc. (“MSCI”) and Standard & Poor’s (“S&P”), a division of The McGraw-Hill Companies, Inc., and is licensed for use by WisdomTree Investments, Inc. Neither MSCI, S&P nor any other party involved in making or compiling the GICS or any GICS classifications makes any express or implied warranties or representations with respect to such standard or classification (or the results to be obtained by the use thereof), and all such parties hereby expressly disclaim all warranties of originality, accuracy, completeness, merchantability and fitness for a particular purpose with respect to any such standard or classification. Without limiting any of the foregoing, in no event shall MSCI, S&P, any of their affiliates or any third party involved in making or compiling the GICS or any GICS classifications have any liability for any direct, indirect, special, punitive, consequential or any other damages (including lost profits), even if notified of the possibility of such damages.
Share & Comment
Popular Posts
Categories
Related Links