
No Room for Error


There is no room for error when markets are priced for perfection.
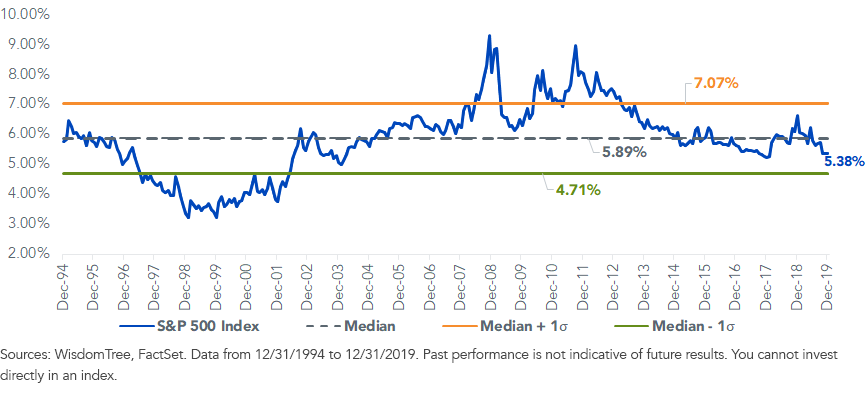
The S&P 500 Index’s forward price-to-earnings (P/E) ratio of 18-19x is nearly 20% above its average since 1986.1 This valuation tells us little about the short-term direction of U.S. equities, but over five to ten years, returns tend to be closely tied to starting valuations.
Some models for valuation-based market returns suggest returns are going to be below average going forward—perhaps as low as 4% annualized over the next decade. This compares to 13.5% returns for the past 10 years, over three times higher.
Wharton Professor Jeremy Siegel uses broad-market earnings yields (the inverse of the P/E ratio) as a guidepost for real (after inflation) equity returns of around 5%—nominal returns of 7%, assuming 2% inflation—for the S&P 500.
While a decent return, that would still be below his long-term average return of 6.8%.
S&P 500 Index Forward Earnings Yield
With these tepid outlooks for the broad index, WisdomTree believes investors must reevaluate how to position their portfolios to achieve adequate long-term goals.
An important variable to consider, alongside starting price-to-earnings multiples, is total shareholder yield—the combination of dividend yield and net buyback yield.
Assuming no growth in earnings or multiple expansion, a higher starting shareholder yield could provide investors an important capital-return cushion.
Many segments of the market can provide combined dividend and buyback yields that get very close to Professor Siegel’s 5% return expectation number.
This means you don’t necessarily need real growth in fundamentals. Current cash flows from today’s valuations can support returns.
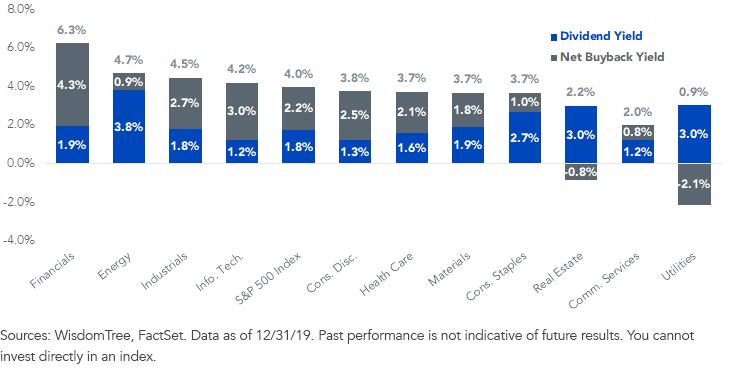
Based on total shareholder yield, Financials and Energy have the highest yields at 6.3% and 4.7%, respectively, while Real Estate, Communication Services and Utilities, traditional high-dividend sectors, have the lowest.
Financials: The Highest Payout Sector
S&P 500 Index - Total Shareholder Yield by Sector
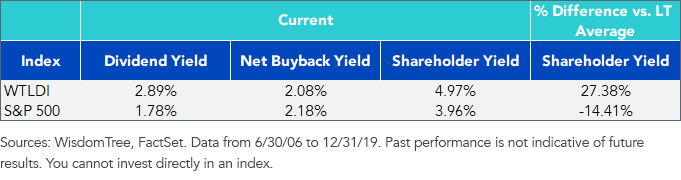
Take the WisdomTree U.S. LargeCap Dividend Index (WTLDI).
WTLDI weights the 300 largest-market-cap dividend payers in the U.S. by indicated cash dividends. That tilts it toward the sectors with higher dividend yields—Consumer Staples, Energy, Utilities, Financials and Real Estate—and away from the lower-dividend-yielding sectors such as Information Technology, Consumer Discretionary and Communication Services.
As a result, the WTLDI has a slightly lower net buyback yield than the S&P 500, but it more than makes up for this with an advantage in dividend yield. WTLDI’s shareholder yield is 101 basis points (bps) higher than the S&P 500 and is currently 27% greater than its own historical average.
Raising Dividend as Source of Return
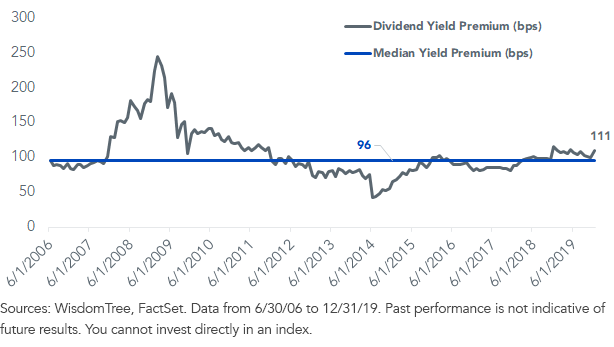
WTLDI’s starting dividend yield advantage is a critical component to improving long-term return expectations. The Index’s historical average yield premium has been 96 bps. Following the Index’s annual December rebalance, that premium increased to 111 bps.
Historical Dividend Yield Premium: WisdomTree LargeCap Dividend Index vs. S&P 500 Index
Amid a low-return environment, the WisdomTree U.S. LargeCap Dividend Index offers some attractive fundamental characteristics relative to the broad S&P 500 Index: a dividend yield of 2.9% and a total shareholder yield of 5.0% (both a roughly 100 bp improvement) and a forward P/E ratio of 16.2x (about a 13% discount).
Both higher capital distributions and a discounted starting valuation can help improve long-term return expectations relative to today’s outlook for a market cap-weighted approach.
1U.S. Equity Strategy in Pictures, “Tabula rasa,” BofA Global Research, page 21, 1/6/20.
Share & Comment
Popular Posts
Categories
Related Links