
Where’s the “Hot Hand”?


If Shaquille O’Neal makes his first free-throw shot, what is the likelihood he makes the second?
Proponents of the “hot hand” theory say it’s higher than Shaq’s 52.7% free-throw percentage because he is “hot.” Detractors would say each free throw outcome is random, so the likelihood of the next shot is simply his overall free-throw percentage.
Research into the existence of the hot hand has been done in virtually every field, from sports to investing, for decades. In investing, the hot hand is referred to as momentum, or trend-following. It has long been ubiquitous across asset classes.
As investors increasingly allocate to passive factor strategies, research has been published1 on the existence of factor momentum—the theory that outperforming factors continue to outperform.
While there is compelling evidence in favor of factor momentum, many investors were caught wrong-footed by changes in factor performance in 2019—from defensive stocks outperforming to start the year to cyclicals outperforming toward the end.
This factor reversal raises portfolio allocation implications for how to position a portfolio for a possible continuation of Q4’s factor leadership.
Factor Reversal
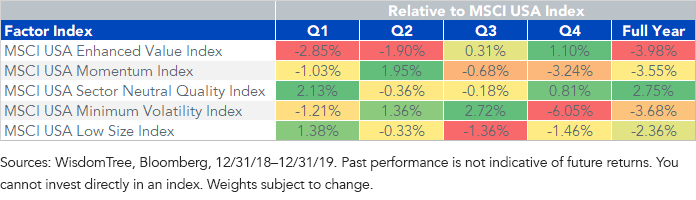
Based on the performance of a handful of the most widely tracked MSCI factor indexes, 2019 was a difficult year for long-only factor investing, and even trickier for factor momentum.
The quality index was the only factor index to outperform over the full year. Only value and minimum volatility were able to maintain outperformance for two consecutive quarters.
Minimum-volatility (min vol) and low-volatility ETFs garnered significant inflows following outperformance in the fourth quarter of 2018 and strong performance through the first three quarters of 2019. The largest min vol ETF took in an astonishing $12 billion in assets for the year.
Global recession concerns on the back of an inverted yield curve, weak economic data and trade war uncertainty were behind the outperformance of defensive, low-volatility stocks. As concerns abated in September, these stocks underperformed significantly through the end of the year.
Riskier, cyclical value stocks became top performers in Q4, outperforming the min vol index by over 700 basis points (bps).
That quarter provides a clear exhibit into the inverse relationship between value and min vol, and the risks of a factor going from having the hot hand to being ice cold.
Excess Returns vs. MSCI USA Index
Investing in the Low Volatility Factor
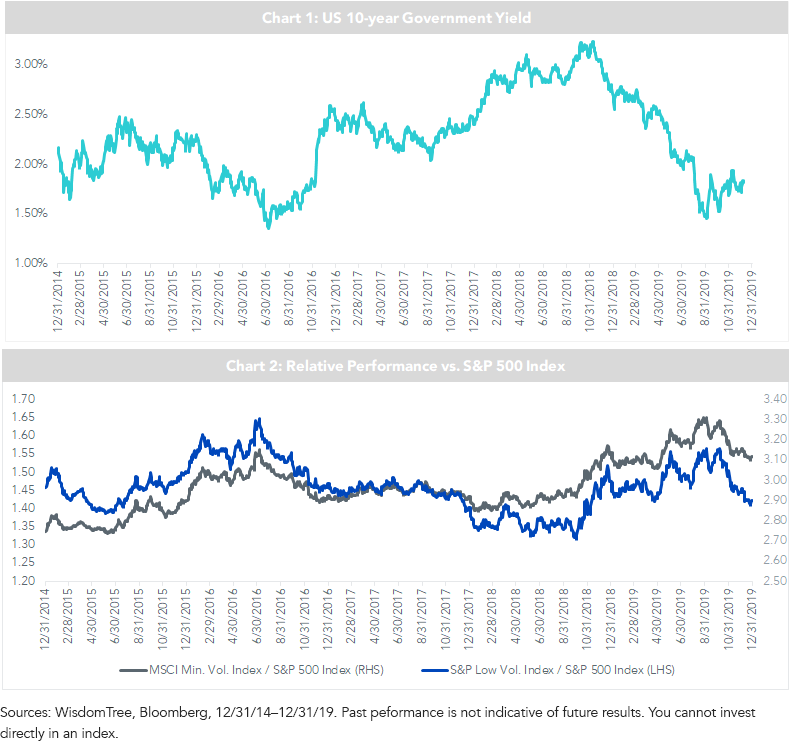
Different indexes track exposure to the low-volatility factor, each using varying definitions, sector considerations and rebalance periods.
Among the most widely followed are the MSCI USA Minimum Volatility Index (MSCI Min Vol Index) and the S&P 500 Low Volatility Index (S&P Low Vol Index).
There are two main drawbacks associated with investing in the low-volatility factor:
- Sector Tilts: Both indexes tend to have sector tilts relative to the broad market, and are typically overweight defensive sectors and underweight cyclical sectors. So low-volatility indexes are very rate-sensitive, tending to outperform during falling rates. As shown in chart 2, the relative performance of both indexes versus the S&P 500 has improved when U.S. interest rates have declined.
- Valuations: As interest rates trend lower, valuations of low-volatility indexes become expensive. The aggregate price-to-earnings (P/E) ratio premium for these indexes increases versus the S&P 500 in periods of falling rates (currently about 15%).
Given the defensive sector tilts and the premium valuations associated with low-vol strategies, portfolios with these exposures face underperformance risk if there’s strong global economic growth in 2020.
Conclusion: Balancing Min Vol with Value
Investors who piled into defensive equities in 2019 now must face the prospects of reduced trade war risks and improving economic data, both of which will favor value over low volatility.
In order to mitigate the risk of underperformance in this type of environment, a value-tilted core exposure can bring down the aggregate P/E multiple of a portfolio and bring sector exposures more in-line with the market.
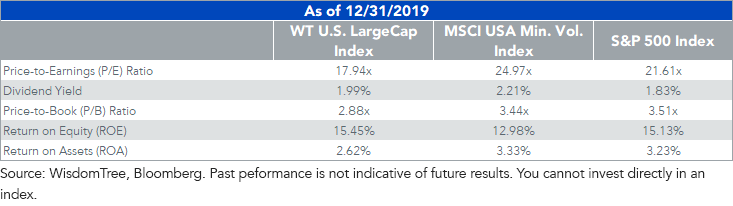
The WisdomTree U.S. LargeCap Index, which completed its annual rebalance in December, is at a 28% discount to the MSCI Min. Vol. Index on a trailing P/E basis, while also having almost 250 bps higher return on equity.
Adding this type of exposure to complement a low vol factor approach can help position a portfolio in case the value factor keeps its hot hand in 2020.
Fundamentals Table
1Tarun Gupta and Bryan T. Kelly, “Factor Momentum Everywhere.” The Journal of Portfolio Management, 2019
Share & Comment
Popular Posts
Categories
Related Links
Alejandro Saltiel joined WisdomTree in May 2017 as part of the Quantitative Research team. Alejandro oversees the firm’s Equity indexes and actively managed ETFs. He is also involved in the design and analysis of new and existing strategies. Alejandro leads the quantitative analysis efforts across equities and alternatives and contributes to the firm’s website tools and model portfolio infrastructure. Prior to joining WisdomTree, Alejandro worked at HSBC Asset Management’s Mexico City office as Portfolio Manager for multi-asset mutual funds. Alejandro received his Master’s in Financial Engineering degree from Columbia University in 2017 and a Bachelor’s in Engineering degree from the Instituto Tecnológico Autónomo de México (ITAM) in 2010. He is a holder of the Chartered Financial Analyst designation.