
Multi-Factor: Identifying Value Companies, Not Sectors


Value is relative. In order to evaluate whether something is trading at a discount or premium, a critical step is establishing what to compare it to.
Academic research on patterns in U.S. equity returns dating back to as early as the 1960s1 found stocks valued at a discount on measures like price-to-earnings tended to outperform market averages, as well as more richly valued stocks.
Some of this research ranked value stocks by comparing companies within the same industries2, but often the sample was taken from all listed equities, subject to constraints like liquidity and market-cap cutoffs. The latter method was used by Eugene Fama and Ken French in their seminal 1992 paper3 on the effects of market beta, size and value.
This is also the method by which many of the most widely tracked value indexes, like the Russell Style indexes, are constructed. Due to the tendency of value stocks to be clustered in the same industries, these indexes have persistent sector over- and under-weights.
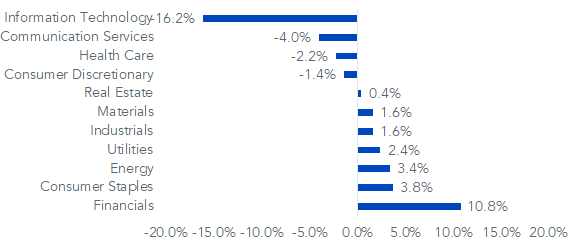
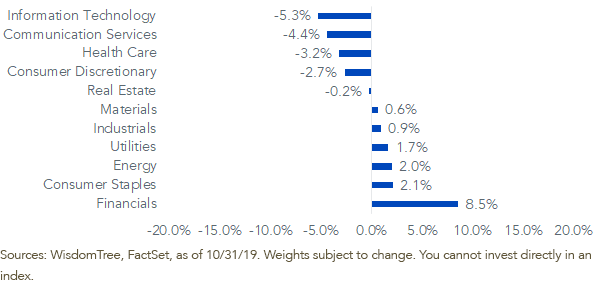
As of October 31, 2019, the Russell 1000 Value Index was overweight Financials by 11% and underweight Information Technology by 16% relative to the S&P 500 Index. The S&P 500 Value Index is also overweight Financials and underweight Information Technology, but to a lesser degree.
Sector Weights Relative to the S&P 500 Index
Russell 100 Value Index
S&P 500 Value Index
Value Sectors
There are several reasons for certain sectors to be structurally value sectors.
The most common justification for cyclicals like Financials, Energy and Materials to trade at lower multiples is that their earnings are closely tied to the business cycle, which increases operating risks. This rationale supports the argument that value stocks outperform because of an associated risk premium, and fits in nicely with the efficient market hypothesis.
Differences in accounting methods also play a role. For example, banks’ use of fair value accounting often causes the book values of equity to be closer to market values. This can make banks appear discounted relative to companies using historical cost accounting, like Industrials, that have market prices much greater than the costs of their depreciated assets.
The risk-based argument lends logical support to an approach that tilts toward value sectors. The thought process is that these sectors are riskier, and investors should be rewarded for the excess risk over time.
The impact of differences in accounting methods, on the other hand, supports an argument that sorting across industries introduces measurement error in identifying value stocks. In other words, perhaps using the same accounting ratios to measure JP Morgan and Boeing causes indexes to unduly favor one as value and one as growth.
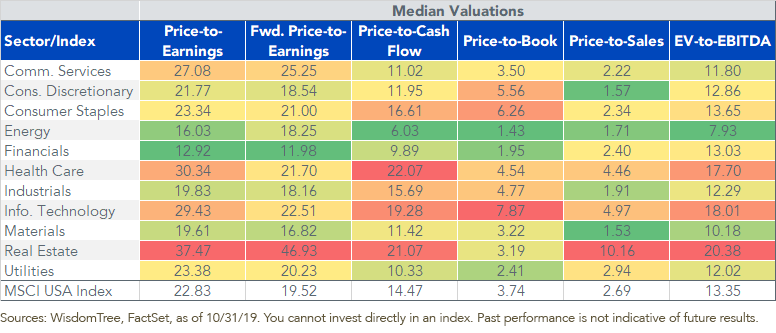
The table below of median sector valuations summarizes the significant differences across sectors. Financials, Energy and Materials have the lowest valuations, while Real Estate, Health Care and Information Technology have the highest.
Value Within Industries
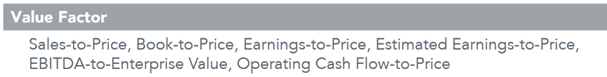
The WisdomTree U.S. Multifactor Index (WTUSMF) uses value as one of four factors (value, quality, momentum and low correlation) being directly targeted in its basket of roughly 200 stocks. The value factor is composed of six ratios, with each company in the universe given a value score relative to its industry. This is done to avoid some of the potential pitfalls of relying on a single measure of value.
Additionally, as part of the weighting process, the sector weights of the index are scaled to be sector neutral relative to the broader U.S. large-cap equity universe. As a result, Information Technology is the largest sector weight at 21%.4 In our view, this process produces an Index that has good representation across sectors, and which relies on stock selection as the driver of alpha instead of on sector tilts.
In the years since Fama and French’s 1992 paper, notable research has been published on improvements in the risk-adjusted returns of the value factor achieved by using within-industry measures.5 In part, this method addresses the accounting differences across industries and results in a more diversified portfolio.
The chart below shows the sector valuations for WTUSMF. Despite its sector neutrality requiring the Index to have a significant weight in “growthier” sectors, the Index’s discounted valuations in each sector result in it having materially lower overall multiples versus the broader market.
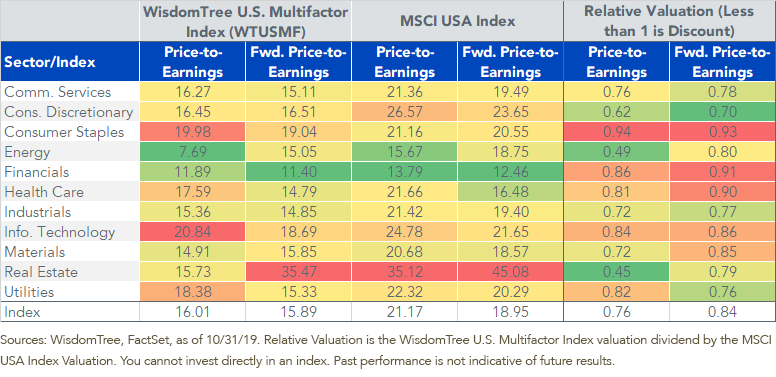
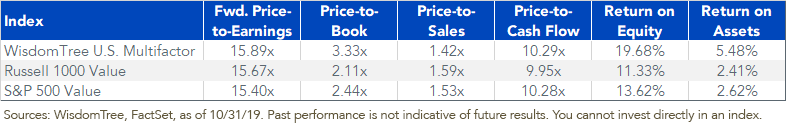
Relative to the value benchmarks, this Index has similar valuation multiples to the single-factor Russell and S&P 500 value indexes, coupled with a distinct quality tilt (higher return on equity and return on assets).
While growth stocks can invariably outperform value stocks over time, we believe our factor-driven approach can add value over market cycles versus simply owning the market.
Given our focus on sector neutrality and multiple metrics for measuring value, we’ve attempted to isolate our sources of alpha instead of blending them away with sector tilts.
1S. Francis Nicholson. “Price-Earnings Ratios.” Financial Analysts Journal, vol. 16, no. 4, 1960, pp. 43–45. JSTOR, www.jstor.org/stable/4469053.
2David A. Goodman and John W. Peavy, “The Significance of Price-Earnings Ratios on Portfolio Returns,” Southern Methodist University working paper, January 1981, 7–9.
3Eugene F. Fama and Kenneth R. French, “The Cross Section of Expected Stock Returns,” Journal of Finance, June 1992.
4WisdomTree, FactSet, as of 10/31/19.
5Cohen and Polk, “An Investigation of the Impact of Industry Factors in Asset-Pricing Tests,” 1998; Asness, Porter and Stevens, “Predicting Stock Returns Using Industry-Relative Firm Characteristics,” 2000; Robert Novy-Marx, “Operating Leverage,” 2007.
Share & Comment
Popular Posts
Categories
Related Links