
The Yield Curve Un-Inverts


Without much fanfare, an interesting development has occurred in the bond market in October: the Treasury yield curve “un-inverted.” I can’t help but to think back to May of this year when the U.S. Treasury (UST) 3-month/10-year note spread fell into negative territory for the first time since 2007 and the news took center stage. Arguably, the heightened news coverage was warranted, given the inverted yield curve’s prior history of forewarning of potential recessions. This raises the question—does the un-inverted curve now flash the all-clear signal for the U.S. economy?
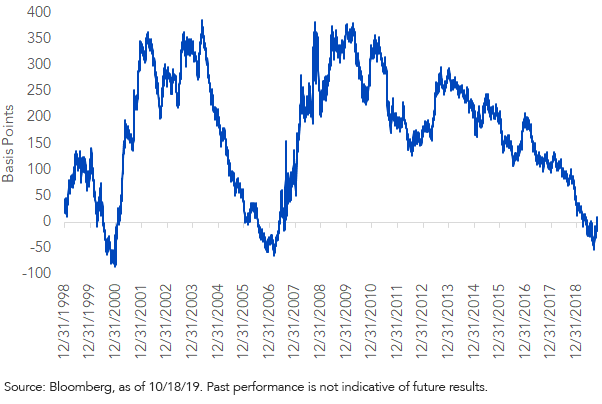
Technically, an un-inverted yield curve simply means the spread between the two aforementioned Treasury securities has moved back into positive area. As of writing, the UST 3mo/10yr spread was registering at +8 basis points (bps), and it has been in plus territory now for the last week or so. This is in stark contrast to just a couple of months ago, when this differential plunged to a low of -51 bps in late August.
U.S. Treasury 3-Mo/10-Year Spread
So, what has happened within the last two months to create such a turnaround? This steepening of the curve has been a function of the yields of both the 3-month t-bill and the 10-year note moving in almost equal, but more importantly, opposite directions. Specifically, since the peak inversion was printed on August 27, the 3-month t-bill yield has fallen about 30 bps, while the 10-year note has seen a roughly 30-bps increase in its yield level.
Let’s take the 10-year first. The yield increase here has been the result of improved U.S.-China trade news as well as economic data that continues to suggest that the labor market setting and consumer spending patterns are more than offsetting weaker readings for manufacturing and investment. For the 3-month t-bill, the current yield reflects that the market is pricing in an additional rate cut at next week’s FOMC meeting and the recent news that the Fed will be buying $60 billion in Treasury Bills to provide sufficient reserves for the funding markets.
Conclusion
Back to the question I posed earlier: is the U.S. economy out of harm’s way? Our base case is for a slowdown in growth, not an outright contraction. The N.Y. Fed’s indicator of a probable recession in the next 12 months stood at 34.8% as of September, a slight decline from the prior month. This latest development from the yield curve will more than likely reduce those odds a bit more for the October reading if the un-inverted status is maintained (the UST 3mo/10yr spread is the key leading indicator for this series). I think a good rule of thumb going forward is a two-thirds chance of avoiding a recession and a one-third chance for one occurring.
Unless otherwise stated, data source is Bloomberg, as of October 18, 2019.
Share & Comment
Popular Posts
Categories
Related Links